Cisco CDR Reporting & Analytics | Docs
Using Device Fields
The moment you have completed the core setup of the app, out of the box you will be able to use certain critical fields like origDeviceName and destDeviceName and also orig_device_type and dest_device_type. As with many of the fields that are split between orig/dest, there are also fields deviceName and device_type that simply are multivalued and hold both values.
Some examples of device_types are: hardphone, jabber_desktop, jabber_iphone, jabber_tablet, unityvm
Some examples of device names: SEP32A06CFF0004, CSF-bobterwiliger
However if you or your colleagues have also set up the Devices Lookup, then a great deal of other fields will also be available across the app, effectively populated from CUCM itself. For example on the origination side you will get origProductName, origUserDepartment, origDevicePool, origUserEmail, origFullName and several more. Likewise the same fields will exist as appropriate on the destination side.
These fields can all be used as easily as if they were fields in the raw CDR, for filtering searches, and as primary and secondary fields in your reports. Furthermore you can mix and match these fields in individual reports and searches with not only other CDR and CMR fields but also with all the other non-CDR fields added on the fly, for instance with Location fields or the Groups and Extensions fields.
Also note that for high level examples of the sorts of things you can do with these fields, you might check out our overview page for Devices
Using Device fields in Investigate Calls
To add them to your results right away in Investigate Calls — simply review our general Usage docs for changing your selected fields. You will find the device fields described above listed in Edit Fields, and you can select them like any other. Once a device field is selected and displayed in your search results, review our Usage docs for how you can add them as search filters just by clicking on them.
Using in the Chart page.
There are several options for using this information in Chart. If you haven’t yet, review our Usage Docs for creating charts.
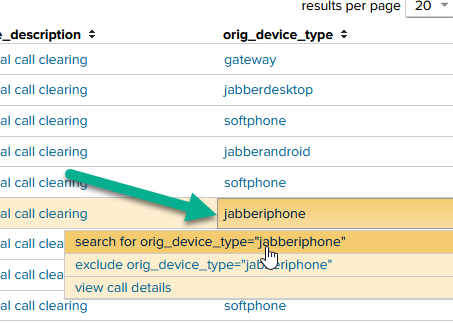
Using it as a search “filter”
The easy way to do this, obviously, is to go back to Browse > Calls and add the filter there, then click the link on the right to » graph calls over time to flip over to the Chart side with those same search filters.

Likewise, these search filters follow you BACK through to Investigate > Calls if you click the “see calls” link in the upper right. In this way, you can jump between Investigate > Calls to occasionally sanity check what you are seeing, while still browsing around different time frames in general reports.
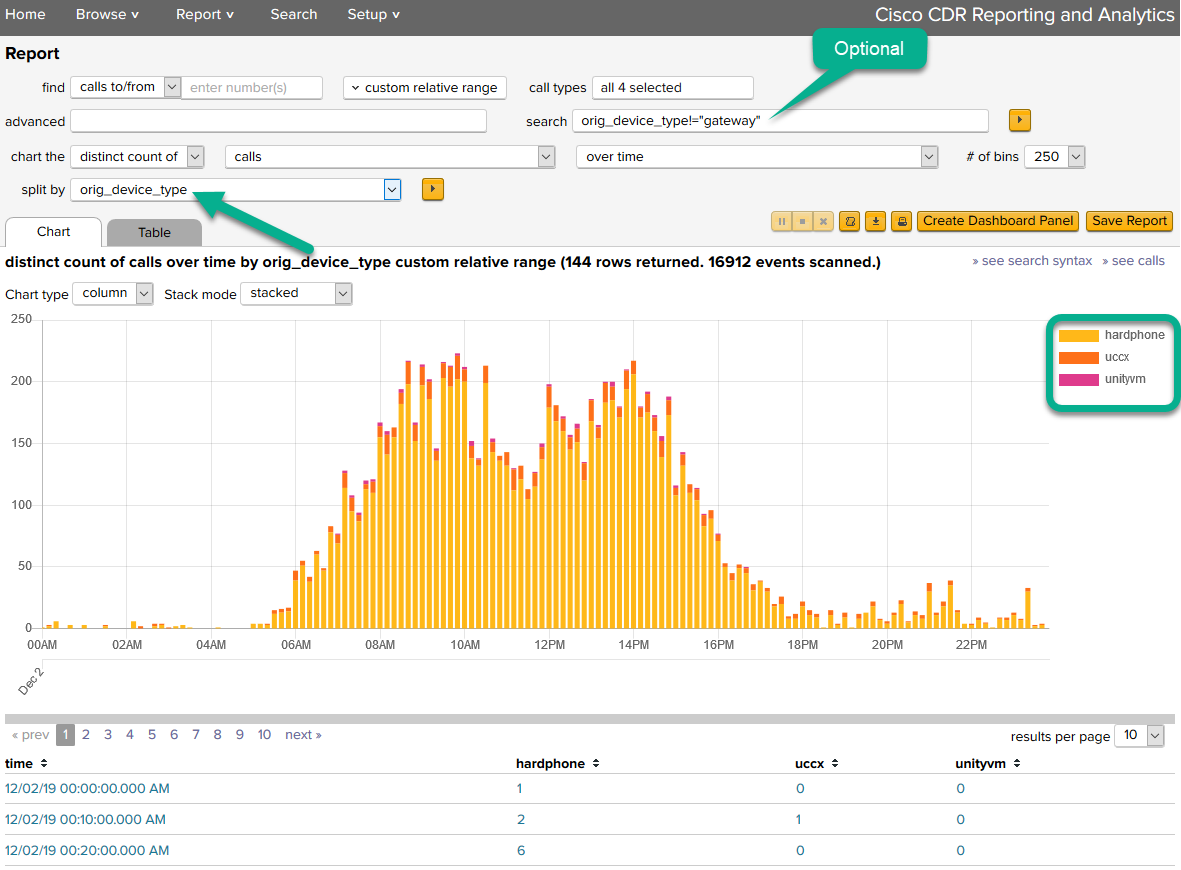
Another way is to use it in the Chart page is by changing over time to over device_type. This is best viewed as a column or bar chart, and instead of call volume over time, ti will give you call counts broken out by device type. Be aware that multileg calls and even single leg calls can and will have more than one device_type value, so the total callId’s on the chart will actually add up to more than the total number of calls in the set.
And of course you can use any of these fields as the split by field. Here, we have gone back to over time but the results are split by orig_device_type.
These are again, just examples and you should experiment with substituting different fields, with your own data.
Using Investigate Devices
Navigate to Investigate > Devices
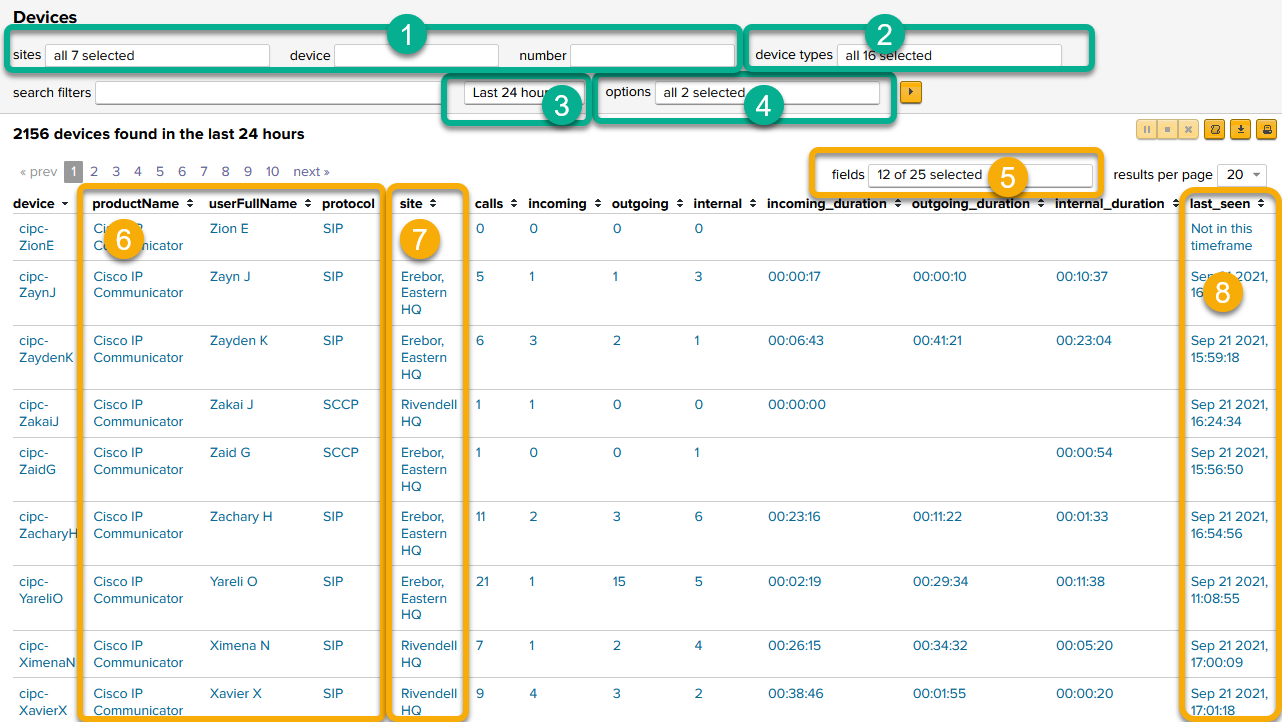
Note the numbers in the diagram above correspond to the descriptions below.
- Filter by:
- site, if you have sites set up.
- device name (wildcards allowed).
- number (wildcards allowed).
- Select any subset of device types – hardphones, softphones, unityvm, conference bridges – whatever you have in your data that you’d like to pick from.
- Change your time frame.
- Two very useful options:
- a) include or don’t include devices that made no calls in the timeframe, if you have devices set up as above.
- b) count or don’t count calls with zero duration in the totals.
- Add or remove fields from the table. Note that there are a large number of fields available that are not displayed by default.
- If you have set up the Devices Lookup, then some additional fields will be non-blank, like these.
- If you have set up the Sites Lookup, you can also add the site into this field list.
- See when the device last made a call:
- NOTE this first line, cipc-ZionE. It has not made a phone call in the past 24 hours (see the time frame #3).
- By having item #4a turned on, and the device list in your system, we can determine that device X exists but hasn’t sent in a CDR record in the time period involved.
- So, by making the timeframe larger and sorting by that last_seen column, you can identify devices that have not made any calls ever, or in the past year, or for however long you have data.
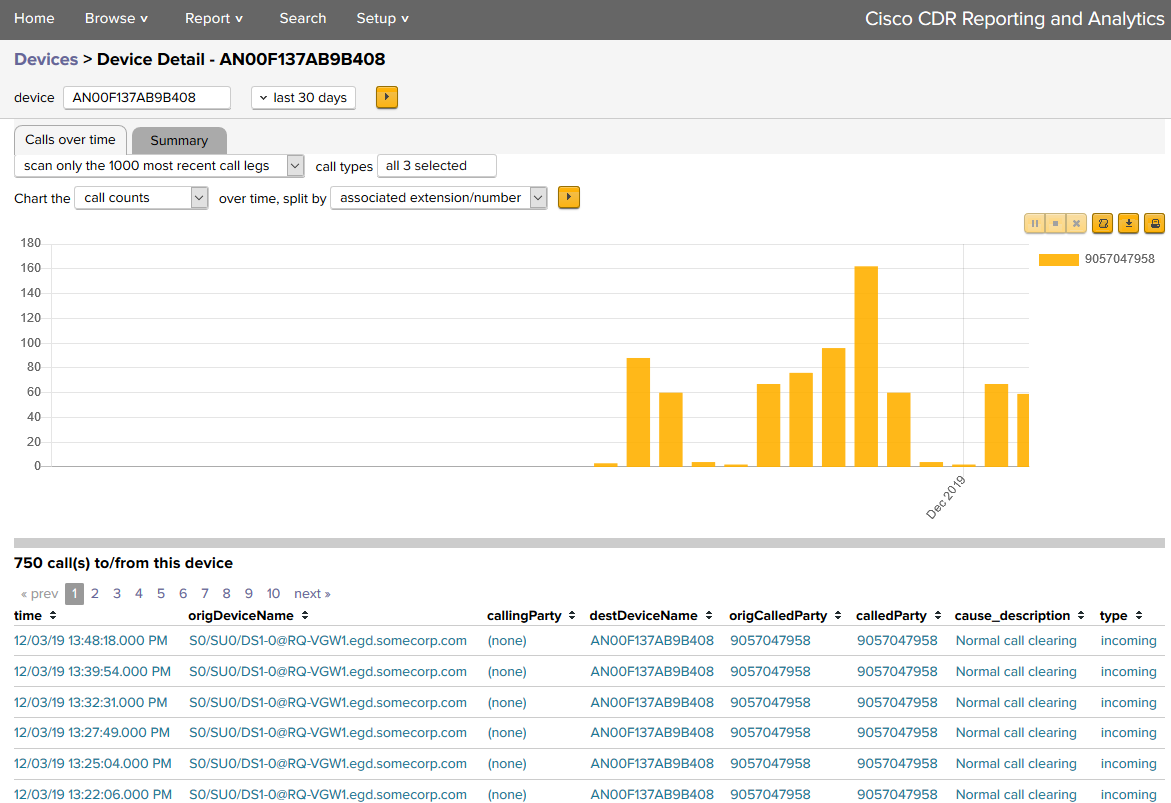
Device Detail
Clicking on any row in Investigate > Devices will take you to a Detail page for that device.