

You wish you could easily see trunks and gateways in CUCM that are getting near capacity.
Concurrency & Utilization
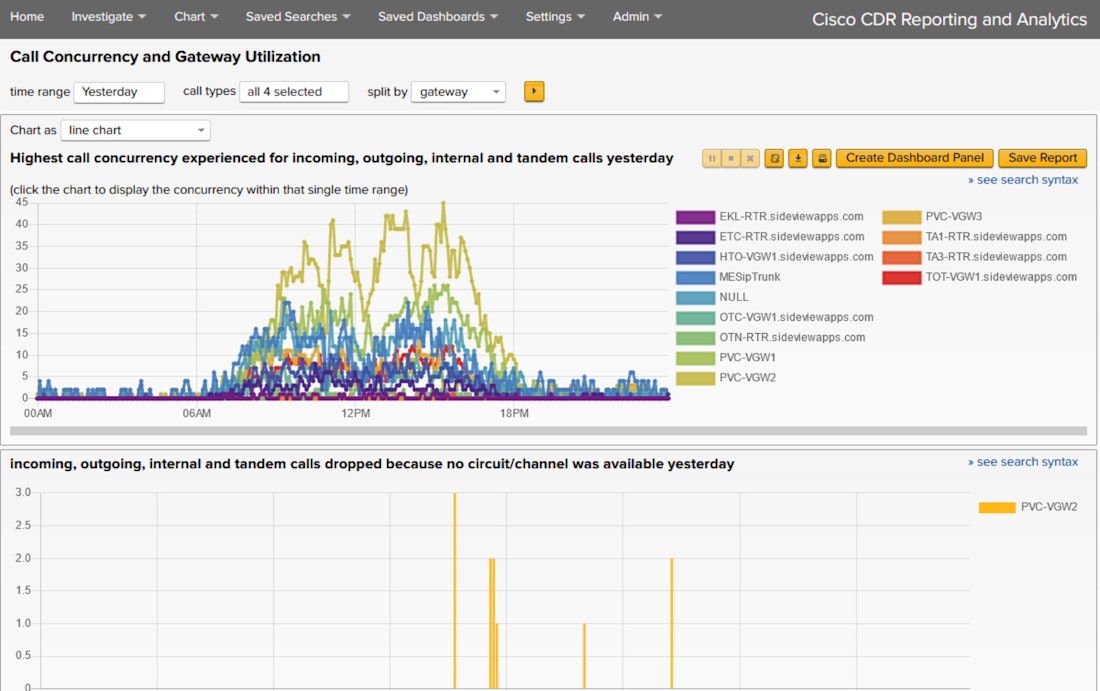
The Call Concurrency and Gateway Optimization was built to answer very specific but important questions about utilization across trunks, gateways, sites, types of devices, and more.
The Cisco CDR Reporting & Analytics app gives you concurrency analytics that are built in from the start. Get specific data around common questions like: What does peak utilization look like over the last 30 days for our legacy trunk at HQ?
Is this you? Just a few Concurrency & Utilization issues that can be answered with Sideview.
You think you could probably get rid of a PRI, but you’re not sure.
A team is saying they’re being crushed by calls all day, and you wish you had a chart to show management.
Which teams and agents aren’t using their provided jabber devices or hardphones.
You’ve made a lot of changes and don’t know what the peak concurrency is now for key numbers.
SIP trunks are working well but you don’t have good charts to prove this to anyone.
You don’t know whether efforts to save money and reduce PRI usage are actually working.
Whether using a scalpel or a sledge hammer, do it with data.
Our Cisco CDR Reporting & Analytics App Lets You…
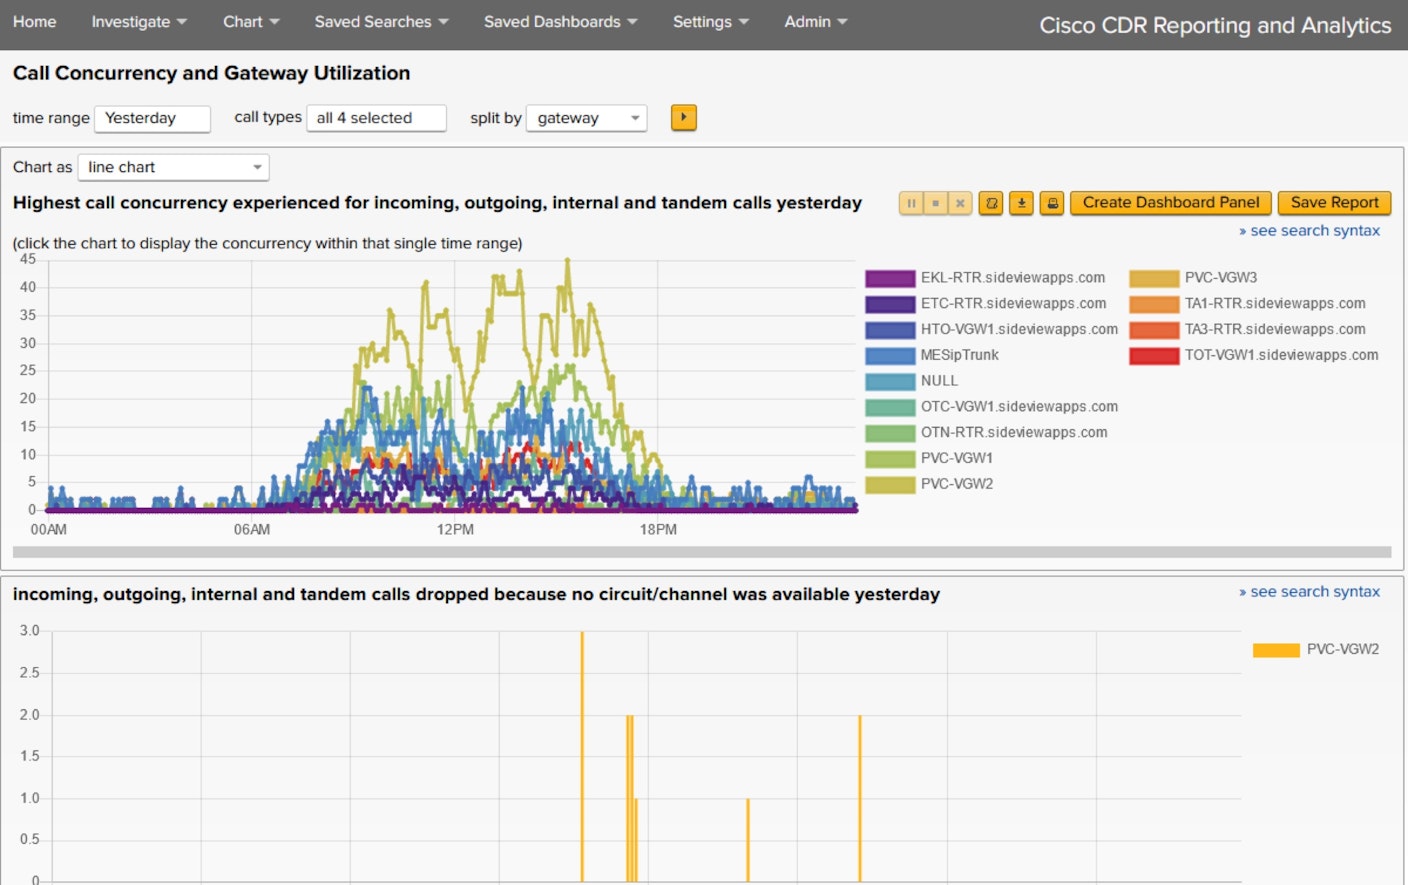
Because it’s such a common question, we built the Call Concurrency and Gateway Optimization page to answer many of your questions about concurrency and utilization at the gateway level.
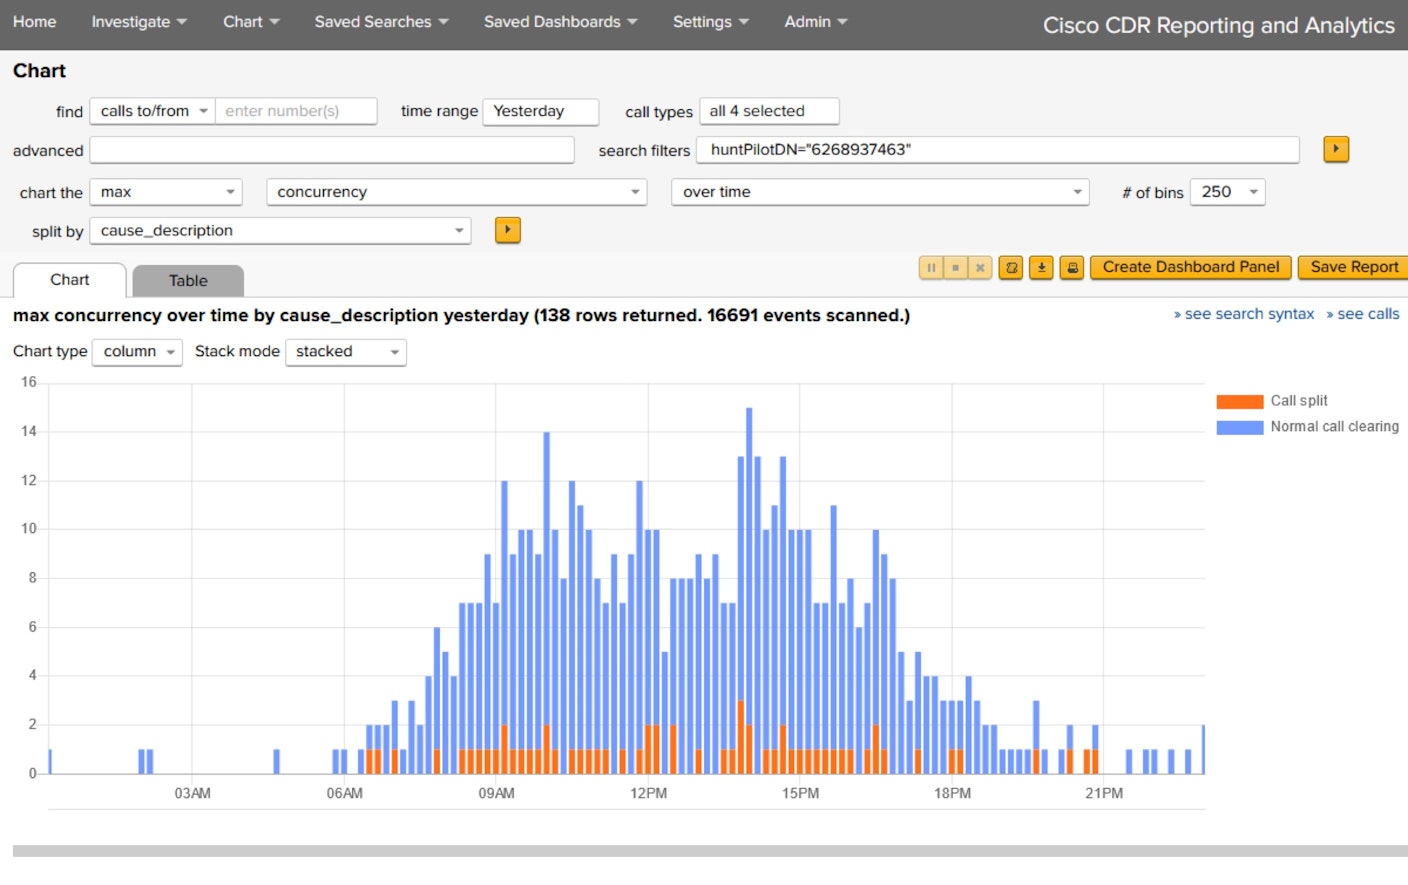
You thought we were kidding? Here’s a chart of concurrency (not call volume!) for the incoming calls to a single huntPilotDN over time, split by the call termination reason.

You still thought we were kidding? 5 clicks from the previous entry and I’m now looking at the concurrency of calls coming through one group of gateways split by the destination device type. So happy these sorts of ad-hoc charts are useful, or else they’d not let me have so much fun making them.
Concurrency and Utilization Content & Resources

“We can create many reports at the push of a button, for which we previously spent hours.”
– Christoph Rolli, Unified Communications and Collaboration Engineer, Fenaco