Cisco CDR
New Concurrency Calculations!
July 12th, 2019
It’s the moment you’ve ALL been waiting for!
We often get asked if the gateway concurrency page could be modified to do other similar things. In thinking through doing that, we realized that most of the extra use cases could be handled much better if there were a “concurrency” field you could use in General Report.
So that’s what we did!
This blog post will walk through how to build a concurrency report.
NOTE you have to be on the latest version of the Cisco CDR app, 5.1.1 or higher.
The Setup
Let’s start here.
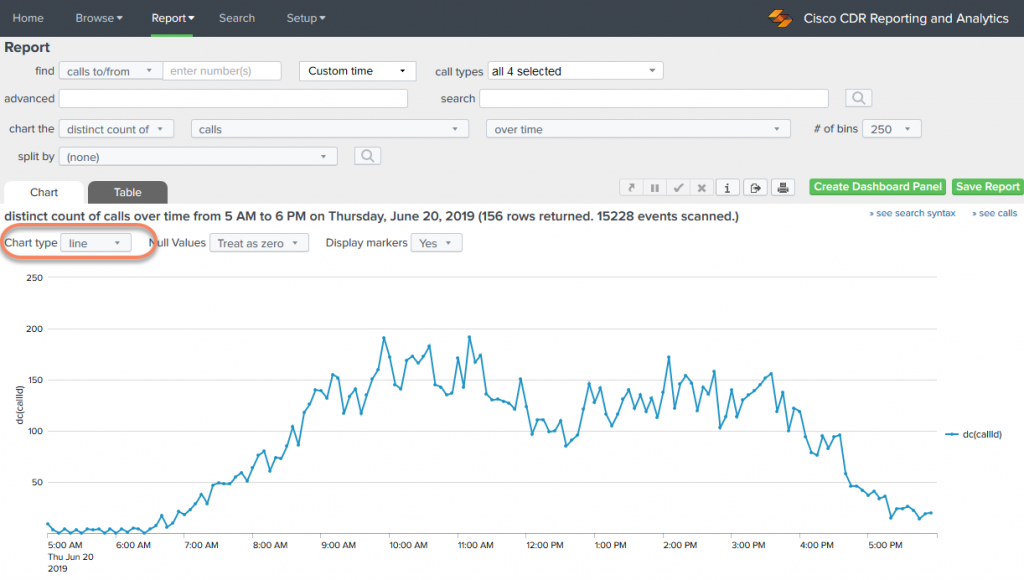
I’ve just selected Report then General Report. I fiddled with the Time picker until I had the right time period displaying. This is what I see.

Note that these are pretty small buckets of 5 minutes each, and that the count of distinct calls runs just under 200 at peak with a little drop at lunch and of course both ends trailing off. As expected, right?
Change to a Line Chart
I happen to think that for our *desired* graph, a line chart will be better, so let’s change that now.
Change the Chart type to line.

Change to Showing Max Concurrency, Gaze Upon its Beauty
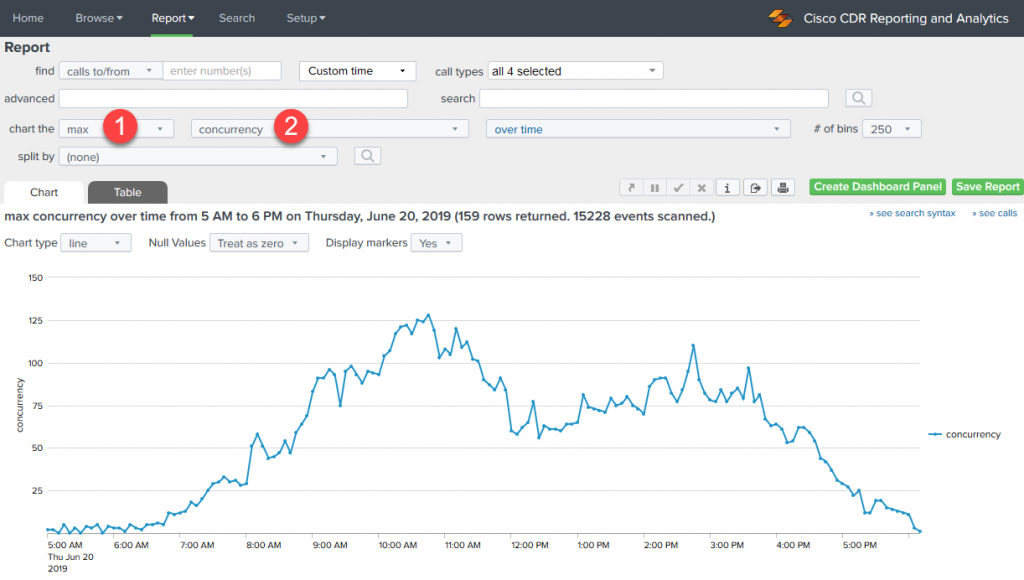
We need to make two changes in the right order. Our lists are smart enough to know that charting the “distinct count of concurrency” is mostly nonsense, and since by default the report has “distinct count of” selected, it won’t just let you pick concurrency until you change the way it’s measuring first.
So we first change the chart the field to max, then we can select concurrency. See the numbers below.

But Wait, There’s More!
That should be pretty exciting already, but because we’re doing this in General Report there’s a whole world of other options available to us.
- The various filtering all still works – individual numbers or groups of numbers, searching, selecting call types – all that.
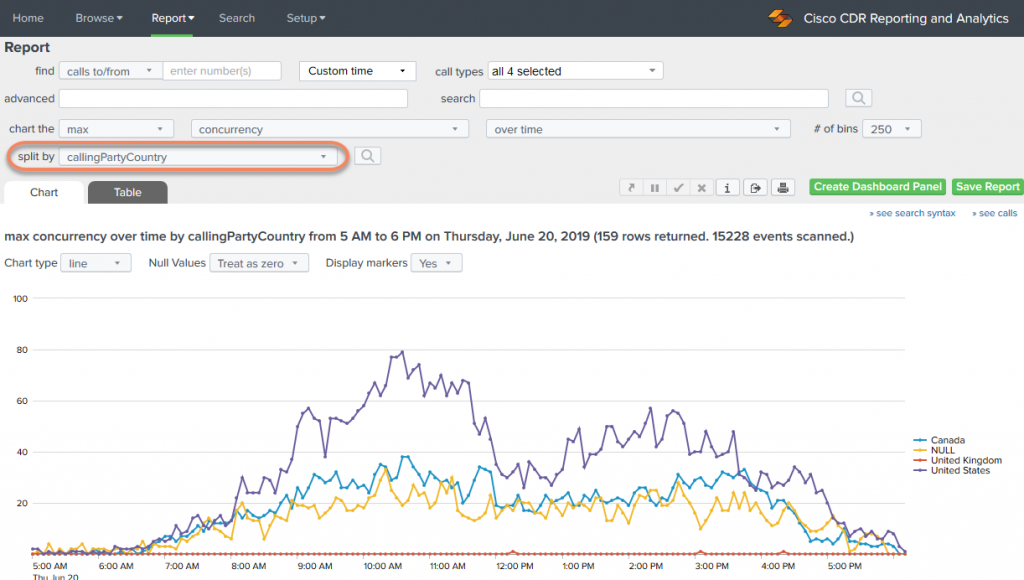
- You can still even split by any other field that’s valid.
For instance, here I split by calling party country. (Now do you see why I thought a line chart was better?)

Final thoughts
Do send in feedback about what you like about the new way to handle concurrency! Email us at feedback@sideviewapps.com.
Also, if you find a particular concurrency chart that you find very useful or pretty, feel free to send them to us!
Final, final thoughts (this is really it, I promise!)
Be aware that when you click over to doing a concurrency report like this, it is very unlikely to perform as well as a non-concurrency report will perform. The concurrency reports just have to do a LOT more work, and they can’t be optimized by Splunk on the back end either. Still, don’t let this scare you off! It’ll work, just a bit more slowly!
Related
Great software ultimately has to empower you to achieve more in less time. This extends to the company behind it -- we have to remember to always use your time as efficiently as we can.
And here I am happy to say that we shortened our Product Overview video dramatically. The new one is only 4 minutes long, vs 11 for the old one. You can see it here:
NOTE: the old one showed more of the product and was definitely more complete. In fact this was deliberate because we used it both for new users and also to be a deeper onboarding video for everyday users. However it was a bit too long for anyone who just wanted the short version and didnt want to spend 11 minutes of their day.
February 1st, 2024

