Cisco CDR Reporting & Analytics | Docs
Using Call Quality Fields
Although there are many call quality fields available in the CMR that you are free to monitor and chart, you can also ignore all of them and use our quality field, along with its configurable thresholds. It is constructed on the fly by essentially checking all of the native CMR fields against a set of quality thresholds that you and your colleagues can even customize. (Note: if you are actually an admin, here are the docs for customizing those quality thresholds . )
Also if as you go through these docs you don’t seem to have any CMR fields at all, return to the installation steps around CMR files to troubleshoot. You can also run our Health Checks inside the app itself in Admin> Run Health Checks.
Using call quality fields in Investigate Calls
- Navigate to Investigate Calls„ and add these four fields using Edit Fields: jitter, MLQK, CSR_overall and quality. (Review our Usage docs on changing the fields if you are unsure how to do this.)
- For fun, click the column header for MLQK in your results table. This will sort the calls from highest MLQK to lowest. This can be very useful for numeric fields.
- You should have a number of values populated for the quality field. Click any of them to add that as a searchterm that will filter your results (Review our Usage docs on clicking to add search terms if you’re unsure how to do this)
Note that if you click MLQK, it will search for only that exact value, ie MLQK=“3.95”, which is not that useful. You can nevertheless do this and quickly hand-edit it to say MLQK<4
This may be a good time to look at our docs about advanced search expressions and booleans.
Using call quality fields in the Chart page
If you have not already, review our Usage docs for creating charts.
For a specific example simply go into Chart and change split by to quality. This will give you a stacked column call-volume report, with a legend item for each of the four quality levels.
Follow other sections in our Usage docs to flip back to Investigate Calls, peek at some other fields, then add some more searchterms, and flip back to Chart, and you’ll be able to iteratively build call quality reports that give very specific insights, narrowed to particular cohorts of calls, callers, devices, sites, etc.
Let’s walk through a specific example of a numeric field
Navigate to the Chart page and change over time to over MLQK.
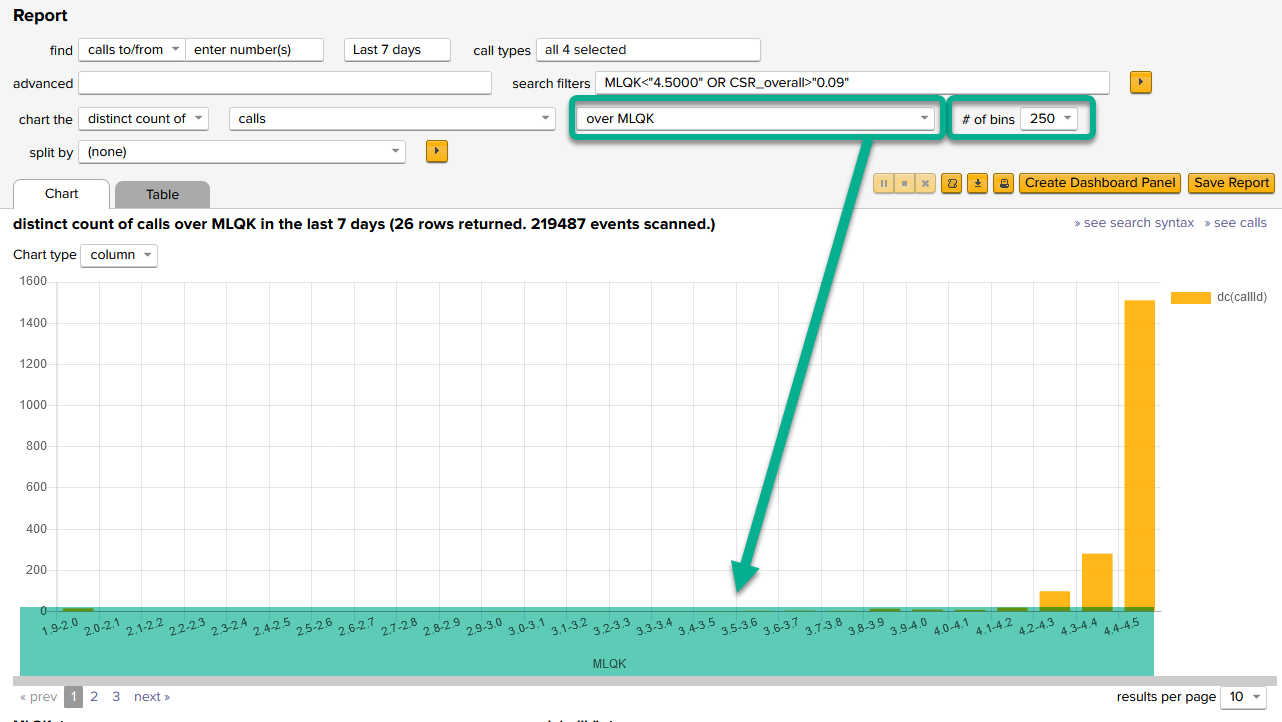
The app is smart enough to know that MLQK is numeric, and it creates bucketed ranges and a numeric axis.
Here it uses a default of 0.1 sized buckets, which is OK. Note that you can use the # of bins pulldown to change the bucket size to a smaller number to get fewer, larger sized buckets.
Sometimes you have to change it a few times to get a granularity you like. Try 5 then try 800 just to see what happens.
Next lets split by a numeric quality field field. This means we go back to over time but then set split by to MLQK.
You will end up with a chart much like the below.
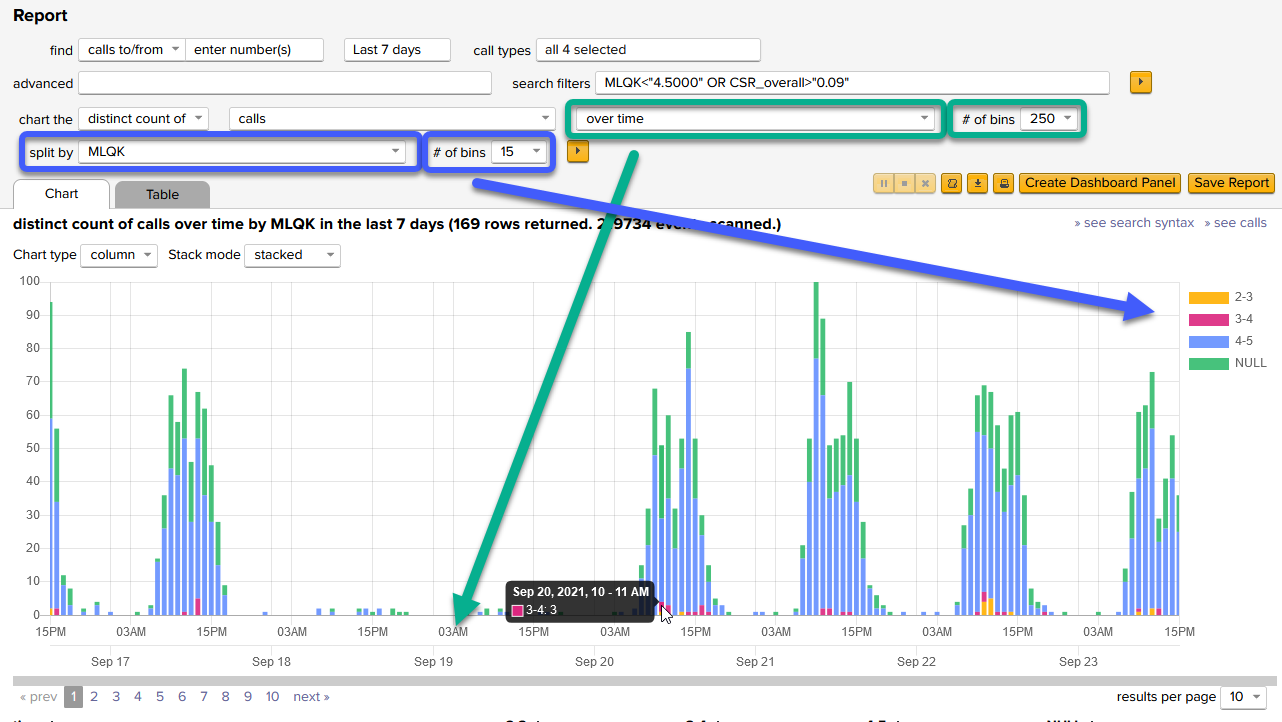
Notice that in green above, the over time has a # of bins pulldown still, but marked in blue above, there is also now a second one for controlling the granularity on the split-by field.
The first is associated with the time, so setting this small gives you fewer but bigger chunks of time across the bottom. The second is associated with the split by field, setting this one smaller or larger adjusts how big of buckets the MLQK is put into. Play with both of those settings a bit (one at a time!) and you’ll see how they work.
Last but not least try clicking on of the bars in the chart.
Further exploration
If you are seeing the fields CS and SCS for the first time and you don’t know what they are, read more about this in our blog on Cisco’s new quality scores.
To find potentially interesting charts about call quality with just a couple of clicks, return to the app in Splunk, click Home to return to the landing page and within Explore new reports on the lower left, click Call Quality.
Also to get more ideas about what sorts of things you can put together, visit our overview page on this website for Call Quality
If you have any comments at all about the documentation, please send it in to docs@sideviewapps.com.