Cisco CDR
Finding and Showing Quality Metrics
August 27th, 2021
Do your users complain of poor call quality? Do you want to find out if they’re imagining it or not?
As with many other things, our app makes this easy.
The cast of characters
If you already know these fields well, then feel free to skip to the next section! Otherwise, read on for a bit of a description.
The elders
Cisco used to only provide jitter and latency information for calls. This was useful, but had some difficulties in actual use. It was hard to compare these for different length calls, and the actual metrics were only proxies for “possibly bad” calls. I mean, sure, lots of jitter is probably bad, but how much is lots? And what about small or medium amounts?
The working class
Later they combined these with the Mean Opinion Score (MOS) based scores: MLQK, MLQKav (average MLQK), MLQKmn and MLQKmx (min and max MLQK). This is a relatively simple system with values that are fairly easily grasped.
But the algorithm they use to determine MLQK doesn’t seem to be consistent across different codecs and using MLQK based scores isn’t easy when comparing calls of significantly different length. The scale leaves something to be desired too – 0 to 4.5 in Cisco’s case instead of 0 to 5, and many devices seem to only report 2 to 4.5. With it taking about 0.5 difference for the call to be noticeably better or worse, that doesn’t give a lot of range. Still, these were quite useful.
The young upstarts
For various reasons, Cisco is now moving to concealed seconds based scores. CS (concealed seconds) is how many seconds of talk time was missing or garbled, but which Cisco “filled in” probably OK enough. The one to worry about is SCS (severely concealed seconds) which are seconds for which a part of the time was garbled enough that it was difficult or impossible to understand. On top of CS and SCS, we build a few fields that make it even easier to compare and contrast different calls with. CSR_overall and SCSR_overall. Both of these are ratios of concealed or severely concealed seconds over all call legs.
Getting more information
You can read more about each of these in our Home tab. In the bottom pane where there’s a list of fields, set the filter by area: dropdown to Call Quality. Yours should list 21, but it might vary depending on what data you actually have. Don’t forget there may be more than one page of results!
Typing a specific term into the search box right in that same row would let you filter down even farther, if you didn’t want to page around and knew what field you wanted to read up on.
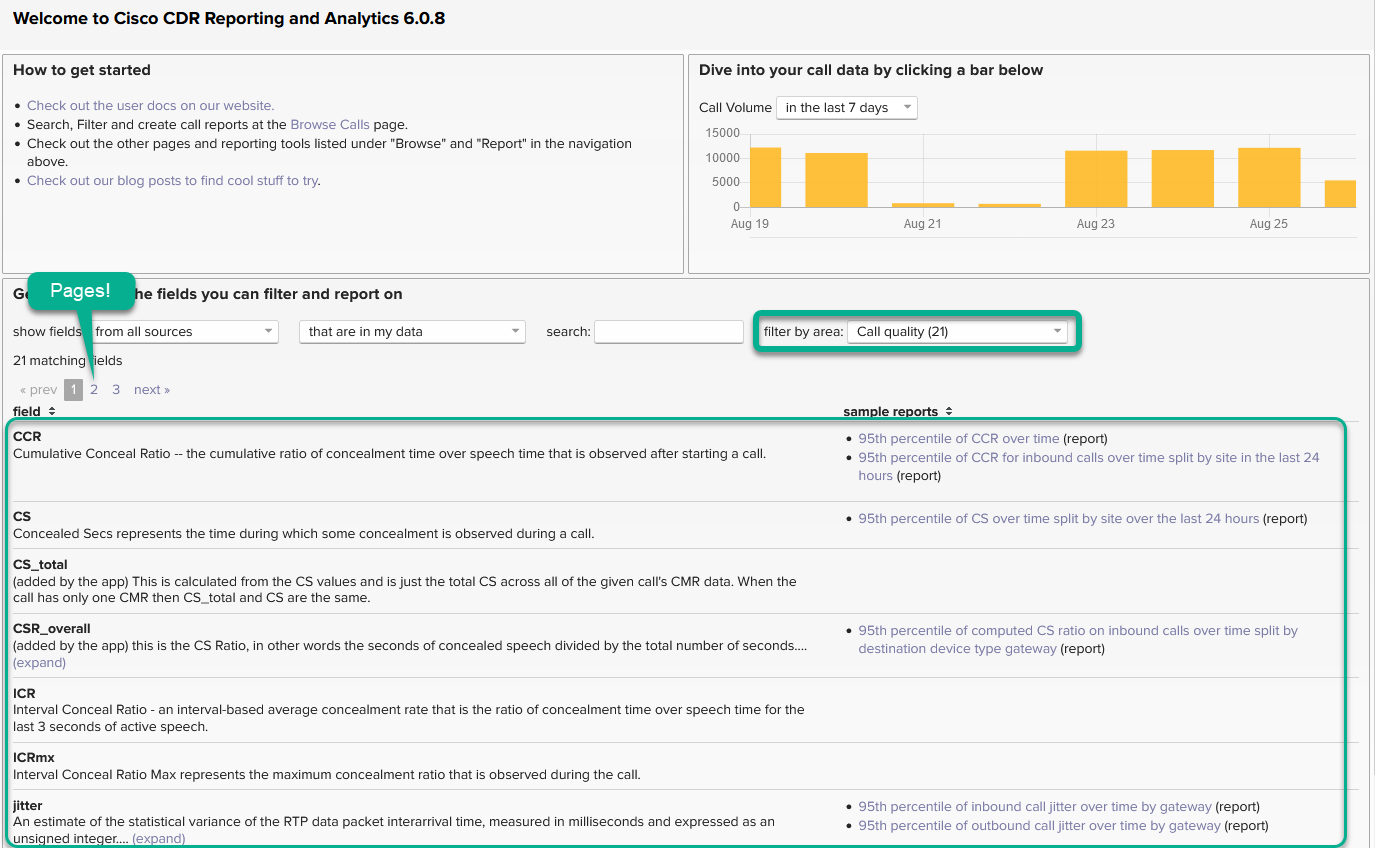
(As with all screenshots on this site, click on it to get a larger version!)
Showing the fields
Now that we know the fields, showing them in Browse Calls is really easy.
- Click Edit Fields in the upper right.
- For each group of fields that you’d like to display, type a part of it into the filter at the top to make it easier to find.
- Then click on each field as you find it to add it to Selected Fields.
- Feel free to just scroll around up and down and up and down until you find it that way, too. To each their own!
- And obviously, I’m adding *all* of them to show you, but if you just want one or two, well, just add those!
- Rearrange fields by clicking and dragging them around as desired.
- Click Apply.

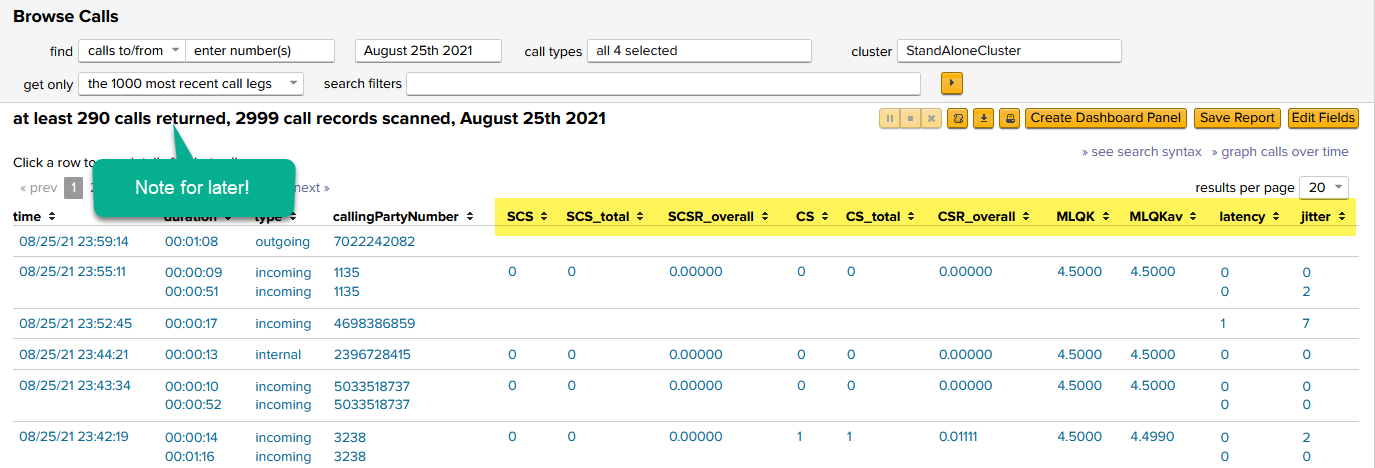
In the below screenshot I have added all of the quality fields. I have also removed some of the number fields and the cause_description field as well so that my tiny screenshots don’t get *too* cramped. You probably will leave cause_description, at least. 🙂
A quick sidebar on the “get only” dropdown pointed out above
The get only dropdown is occasionally very important when browsing sparse data. Browse Calls is built to be fast, and one of the ways it does that is that it only by default looks back at the last few thousand call legs in any time period. You can see it read about 3000 records off disk and returned 290 calls in my test data for August 25th.
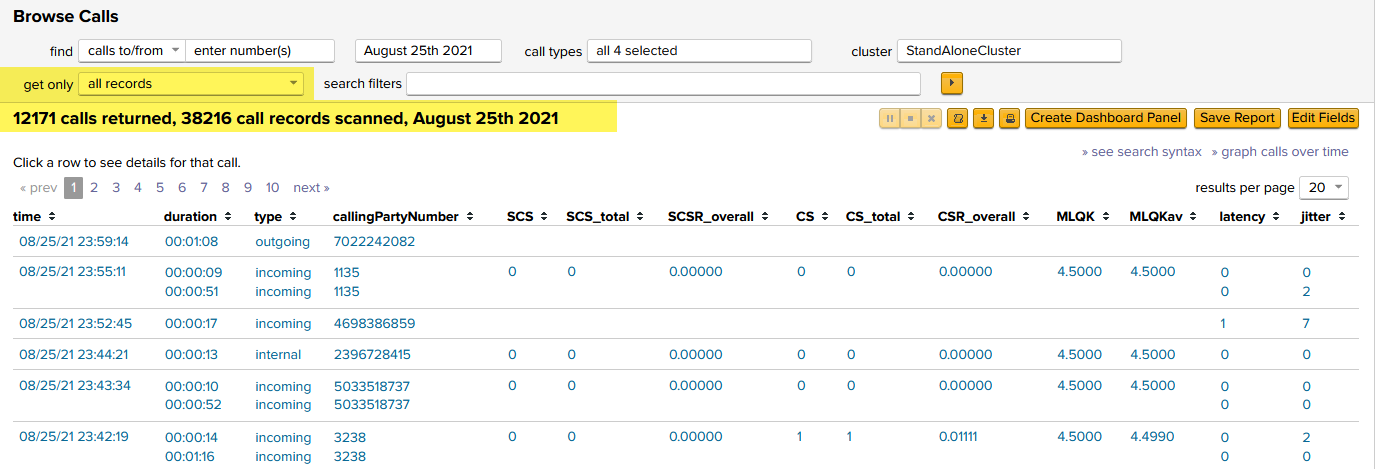
But if you are trying to find a needle in a haystack and your haystack is significantly larger than 1000 calls, you won’t get all the results you need until you flip that to a larger setting. Like in our case, I’ve got about 40,000 calls per day and later we’ll be filtering things to only show a small portion of those calls. If I left the dropdown at its default of only the last 1000 call legs, I’d just be missing a lot of my filtered data from the list.
Here I’ve changed it to all records and you can see that except for returning a lot more calls, nothing really changes. Later, this will be important.
Sorting
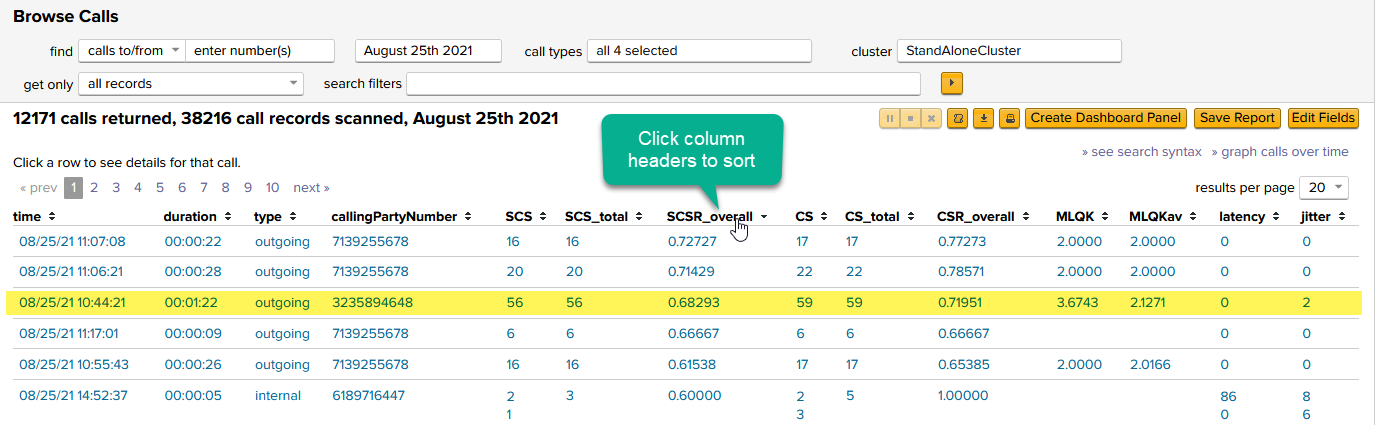
Not surprisingly, Browse Calls acts a little like a spreadsheet. Click a column header to sort that column descending, clicking it again toggles it from descending to ascending and back again. For some reason folks forget you can click on time to change back to the original “by time” sort order.
Following the “spreadsheet” theme, there’s even an export button available. Second button to the left of Create Dashboard Panel looks like

and will just export the results as a CSV file that you can open in Excel, Google Sheets or even a text editor. Do note there are Splunk limitations on how many records you can export using this method, but it’s usually pretty high (By default up around 50,000 I believe).
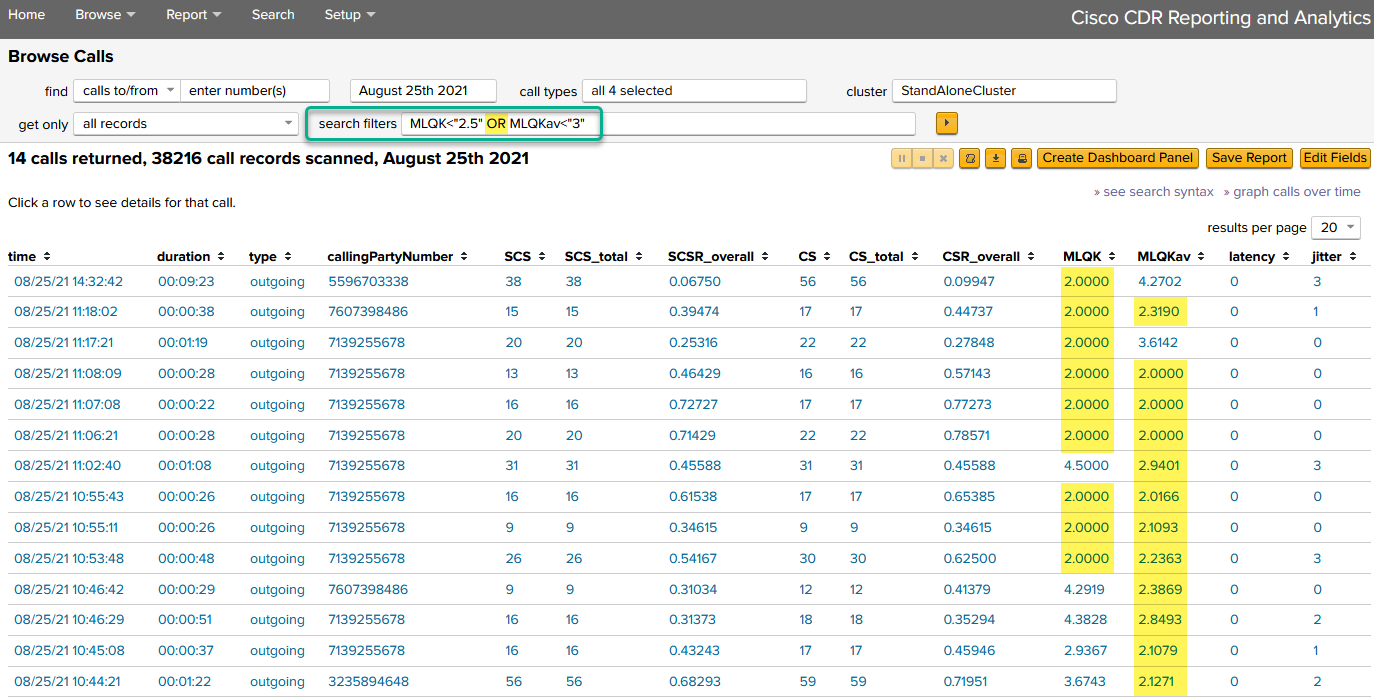
And I’ve already found something *extra* neat!
That third call down (highlighted) is very interesting. Someone stayed on the phone for almost a minute and a half where nearly a minute of it – 56 of the 82 seconds – were unintelligible. It did end on a high note – the last 8 seconds had an MLQK of 3.6 which is generally fine. Though note the MLQKav gives the same story as our CS and SCS numbers at 2.1271, which is pretty poor.
The rest of the calls there are rather short which is to be expected – an MLQK of 2.0 or SCSR_overall of 50% or more means after a bit of trying to understand one another they just hung up. “What? Hello? What did you say? Oh, never mind I’ll call back in a few minutes.”
Filtering
Oh, the fun we’ll have!
Filtering MLQK
Let’s look for where MLQK is under N. Where N is whatever you would like.
- Click on a field with an MLQK set. It doesn’t really matter which you pick, because we can change the *actual* number easily later.
- Select search for MLQK=”N.NNNN” like in my example here, search for MLQK=”2.0000″
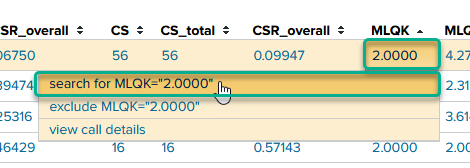
- The app adds a search filter of MLQK=”N.NNNN”, like in my case, MLQK=”2.0000″
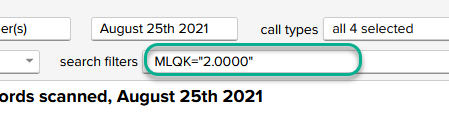
- That is easily changed – it’s just a text box!
- MLQK<“2.0000” to find all calls where MLQK was under 2.
- MLQK<=”2.5000″ to find all calls where MLQK was under or equal to 2.5.
- MLQK>”2.0000″ to find all calls where MLQK was *better* than 2.
- Erasing it from the search filters box and re-running the search … well I’ll give you three guesses as to what that does!
Filtering SCS/CS scores
This work exactly like the above. Let me erase my existing MLQK search filter and show you this too.
Let’s search for SCSR_overall over 30%. That’s where 30% or more of the call was garbled.
- I sorted my SCSR_overall field descending, just to find something at or close to 0.3 just to make life easier – you can really click on anything because we’ll change it in a minute!
- Click on a value near to 3 , and select search for SCSR_overall=<whatever that was> to put it into the search filter box
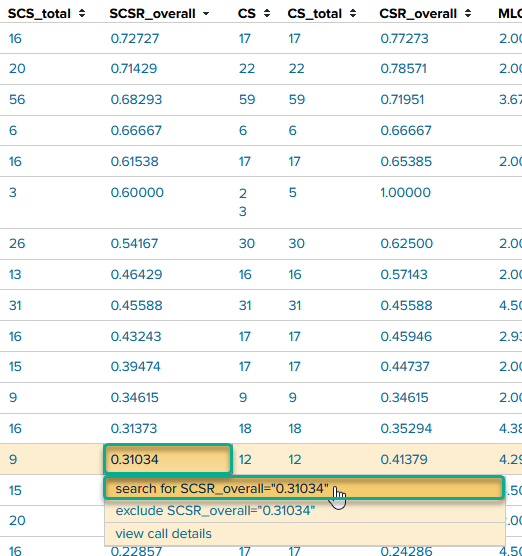
- Now that it’s there:

Edit it to say SCSR_overall>”0.3″ and press enter to run the search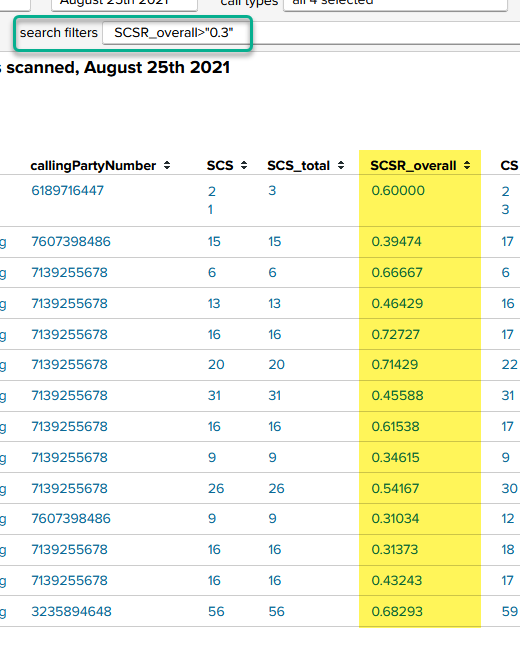
- Remember, you can use >, <, >=, <=, or =.
Multiple Filters – AND
I’ve shown you how to filter to a certain subset of calls based on one criteria or another, but what if you wanted multiple search criteria?
Also easy – it’s exactly like above, only just filter it multiple times. The default boolean join is an AND, so if you have multiple terms they’ll be X AND Y (AND Z etc…)
Let’s say you want where MLQK was below 2.5 and also where MLQKav was above 3. This would be calls where the overall quality was OK (3 and above), but where the last 8 seconds was pretty bad (2.5 and under). Calls that “went downhill”.
- Click on an MLQK (as above) and add it to a search filter.
- Edit it to be MLQK<“2.5” and run the search to set the first filter
- Click on an MLQKav and add *it* to the search filter
- Then change that one to MLQKav<“3”

So we just “AND”ed two filters together. Pretty simple.
Multiple Filters – OR
Suppose you want to see where either they hung up in disgust because the last 8 seconds of the call was terrible OR where the entire call was pretty bad?
What we want here is to use a search filter like MLQK<“2.5” OR MLQKav<“3”, but can we?
Of course!
- Using the methods above, add and edit your search filter to have MLQK<“2.5” in it.
- Then also add and edit MLQKav<“3”.
In re-running this example, I left my get only dropdown set to the most recent 1000 call legs. You can see it is even warning me about this!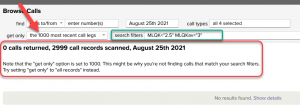
(To fix I just change the get only dropdown to something larger) - Now, add an OR between the two terms so it looks like MLQK<“2.5” OR MLQKav<“3”

You can add as many of those as you want. If you mix OR and the default AND together, be careful and parenthesize!
Filtering with phone numbers
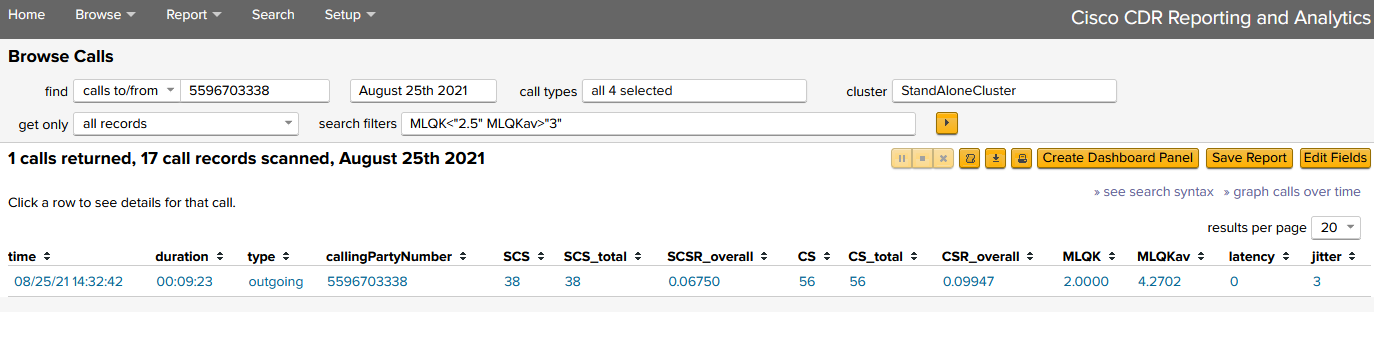
You can also filter by phone numbers. Here I just clicked on one of the numbers and am selecting see only calls to/from <number>

And that gives me just the one result.
Multiple numbers are supported too
You can add more numbers in; usually it’s easiest to just type them in with a comma between then. Wildcards are supported, so this here: 112233, 4545*,*5555 will find where the number is 112233, where it starts with 4545, or where it ends in 5555. That last option is handy if you don’t know for sure how the number looks in the CDR data. For instance, if my number was 7158917420 but I don’t know if UCM will report that as 17158917420 or 917158917420, I could just use *7158917420 to catch them all.
And by now, you should realize you could remove one or more of the search filters that are in place to “widen the scope” a bit if you wanted.
Final Thoughts
If you stumbled across this article and haven’t installed our trial yet, you should do so.
Download your 90 day trial license now.
Building a “report” of any of this is also real easy, so if you wanted a pretty chart out of MLQK values over time, or even of counts of the MLQK values (not over time), jump straight to step 4 in our Quick Wins blog to put it on a chart!
And, our docs on Quality also rehash similar information in a different way, so it might help too.
Lastly if you have any questions, about how to do other things – first search our documentation and blogs, but if you can’t find an answer send us an email at support@sideviewapps.com.
And as always, if you have any feedback on the above instructions email me at docs@sideviewapps.com.
Related
Great software ultimately has to empower you to achieve more in less time. This extends to the company behind it -- we have to remember to always use your time as efficiently as we can.
And here I am happy to say that we shortened our Product Overview video dramatically. The new one is only 4 minutes long, vs 11 for the old one. You can see it here:
NOTE: the old one showed more of the product and was definitely more complete. In fact this was deliberate because we used it both for new users and also to be a deeper onboarding video for everyday users. However it was a bit too long for anyone who just wanted the short version and didnt want to spend 11 minutes of their day.
February 1st, 2024