Cisco CDR
Quick Wins, #1 – High Value Information
September 14th, 2020
Sometimes all you need are the basics.
Are we having problems with failed calls? Are the gateways provisioned well? Are we missing a lot of calls?
That’s exactly what we’ll show you today. And stay tuned, because the next installment will use these as examples for building a dashboard for management.
- General Gateway Utilization
- Gateway Utilization by Site (and others)
- Failed Calls (method 1, general failed calls)
- Failed Calls (method 2, percentages by gateway)
- Unanswered calls
This is the web, so click any image for a larger version of it!
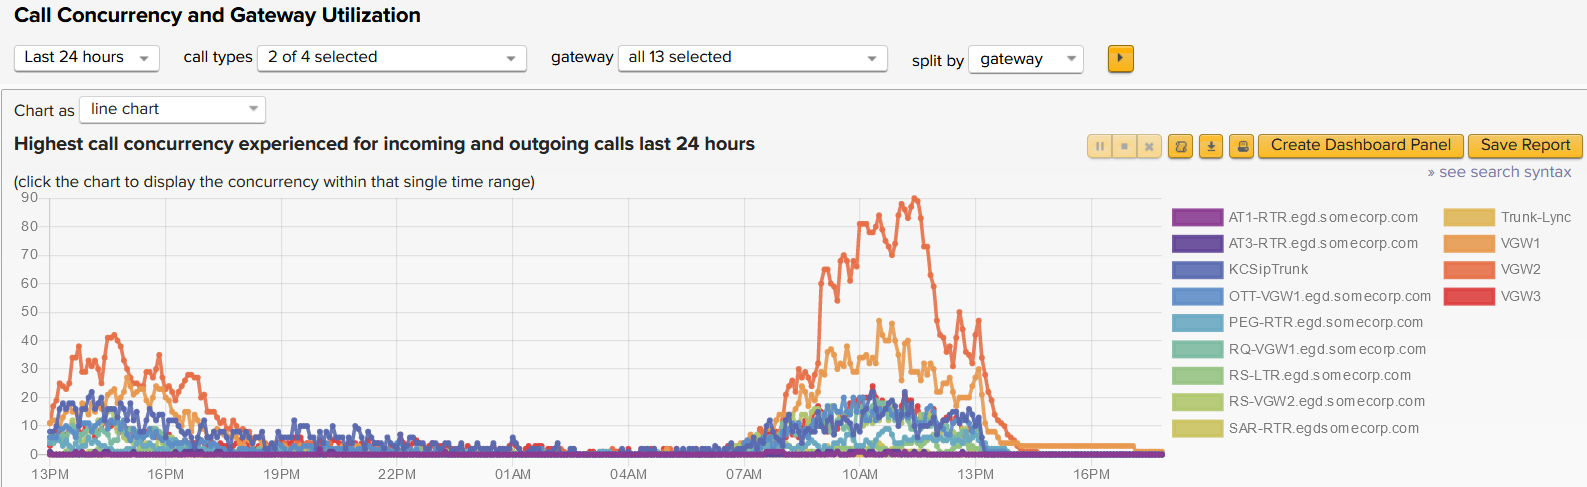
Gateway Utilization
If you never use more than 8 lines out of the 46 that you pay for, maybe it’s time to downsize and save that money?
Get it from Report -> Call Concurrency and Gateway Utilization
Fiddle with the time periods as appropriate, and also don’t forget you can filter down to just a subset of gateways with the drop-down. For instance here I set it to look back 30 days, and only show 3 of the 13 gateways.
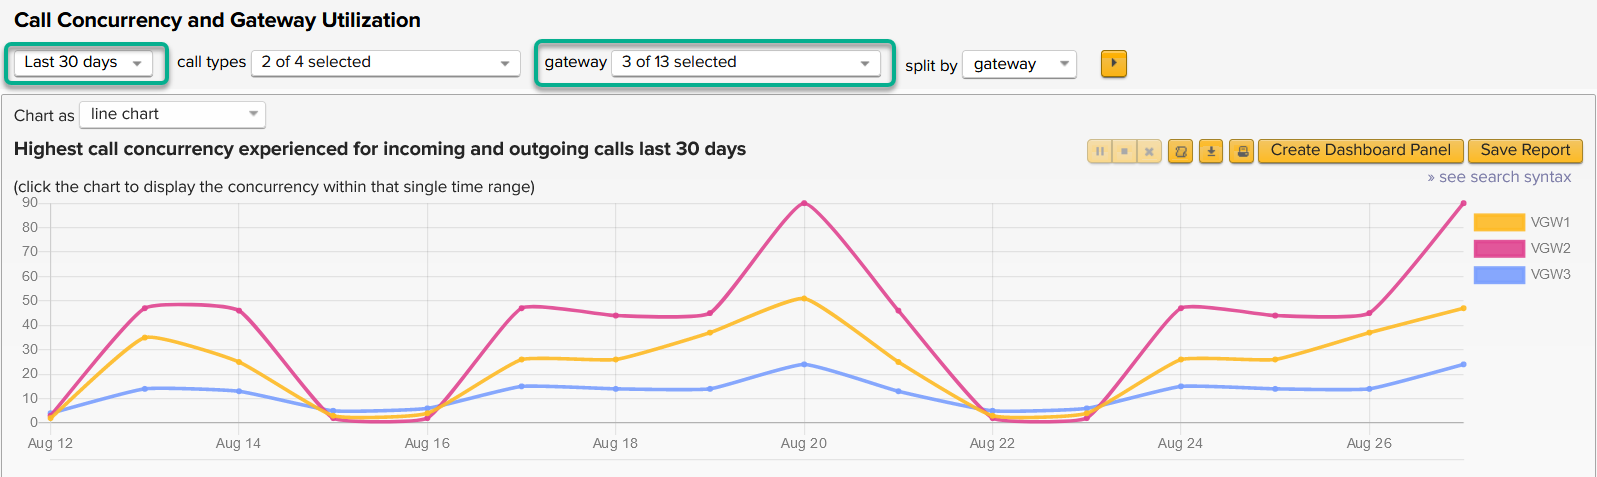
These are peaks – so on Aug 20th VGW2 just touched 90 concurrent calls, meaning I needed no more than about 90 lines to handle that.
Use that same data split by “site”
How many people do you pay to answer the phones for your phone center?
If you have sites set up, you can split the call concurrency report by site. (Maybe you don’t even need sites for your use case!)
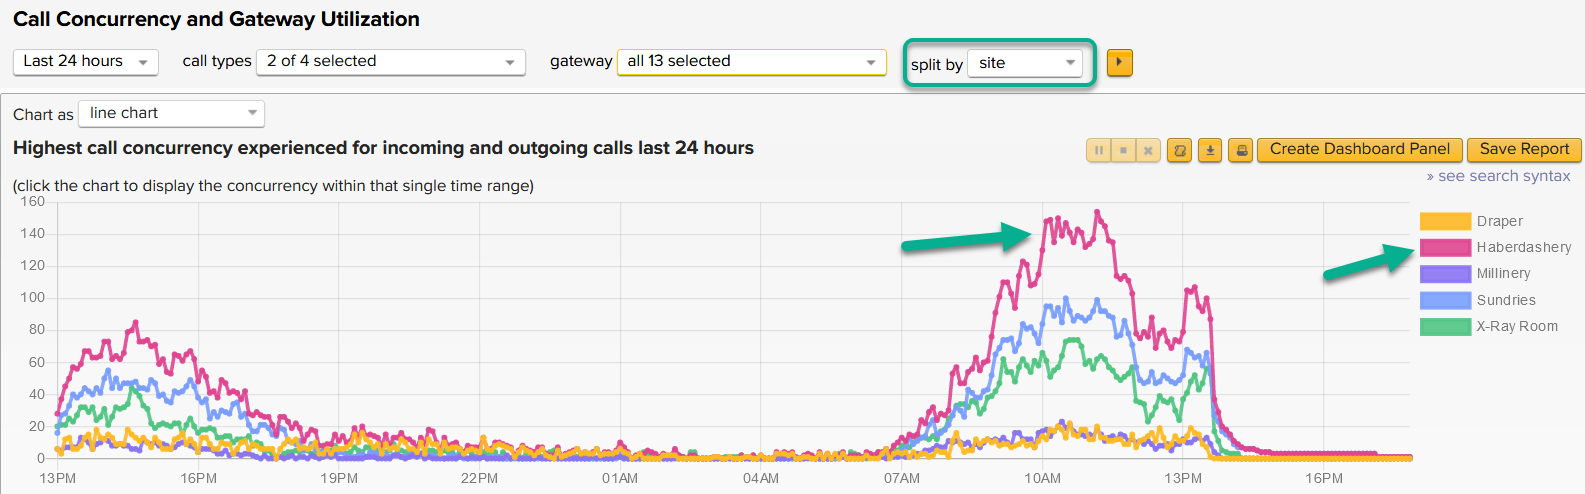
From that I can see that during the late morning today we had a steady 145 t0 155 concurrent calls at the Haberdashery department. That’s some pretty impressive hat selling! Of course if we’re paying 300 people to answer phones during that period, maybe that needs adjusting?
Finding the broken things
A super fun, useful search we do a lot of.
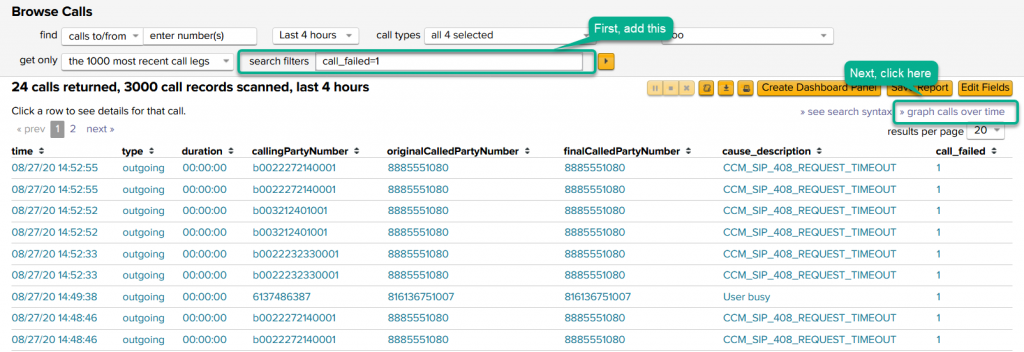
- Go to Browse Calls
- So you can see what’s going on, use the Edit Fields button in the upper right to add the field call_failed to your search.
- If you don’t see that field, you should update your apps! This field was released with version 5.3 on April 25th, 2020.
- Add a search filter of call_failed=1 and run the search. Maybe this is all you need to be able to dig into what’s happening, but remember we’re doing this for Management so let’s put it on a pretty chart.
- So, after you’ve run that, click the »graph calls over time link to go to General Report
- In General Report change the time frame to something interesting, and change the split by drop down to cause_description.


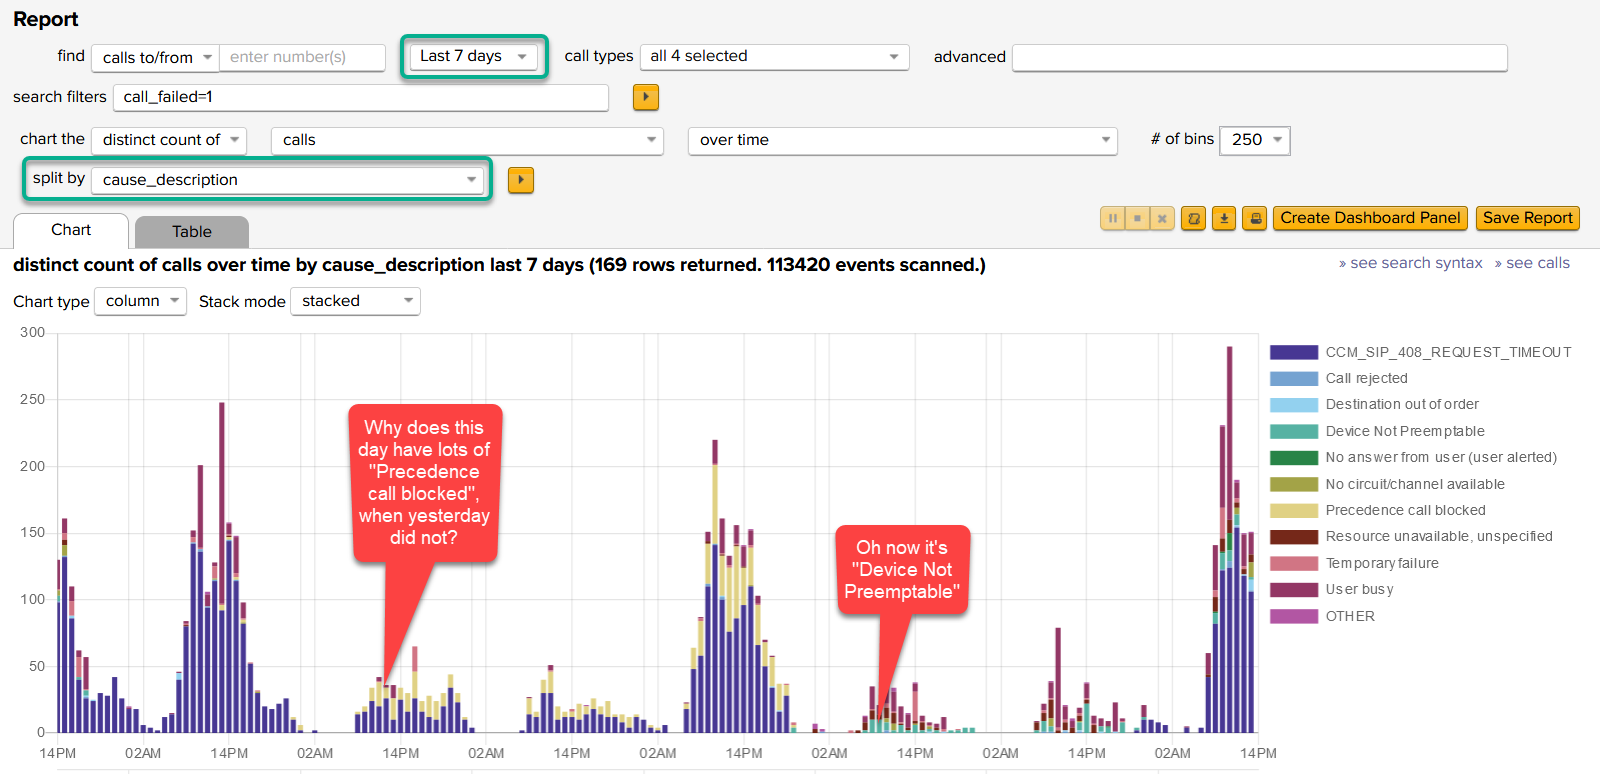
You can tweak it more if desired.
- For instance, my test data has a lot of CCM_SIP_408_REQUEST_TIMEOUT. You can see them in purple above.
- Let’s pretend we actually don’t care about those for this report and remove them.
- To our search filters form field, add NOT cause_description=”CCM_SIP_408_REQUEST_TIMEOUT” (The whole search filter is now call_failed=1 NOT cause_description=”CCM_SIP_408_REQUEST_TIMEOUT”)

A different view of failed calls
Let’s face it, failed calls are not good. Well, usually, at least if there’s too many.
This is why there’s several ways to get at that sort of information in our app. Here’s another way.
- Click Browse -> Gateways
- Click on the column header for failedCallPercentage to sort highest to lowest.
- And hopefully rejoice because all the percentages are reasonable! Or possibly cry a little inside.
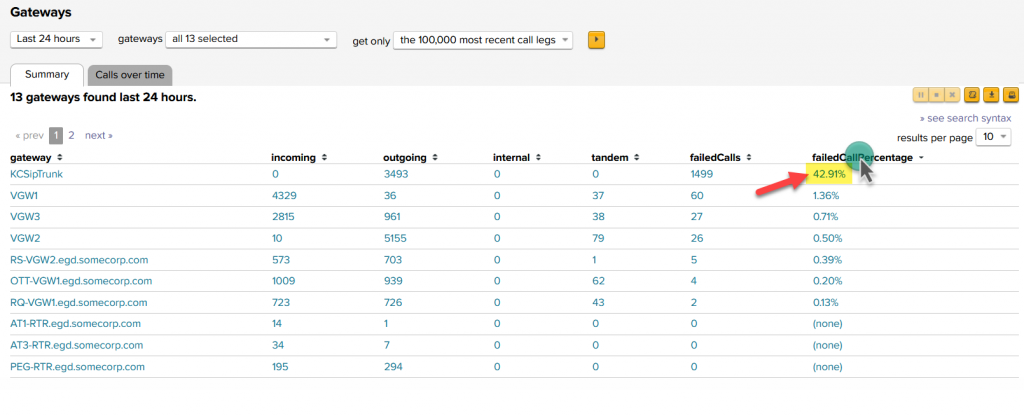
- You can of course continue clicking on things to drill in deeper on those errors!

Unanswered Calls
Far more simple than it might look at first!
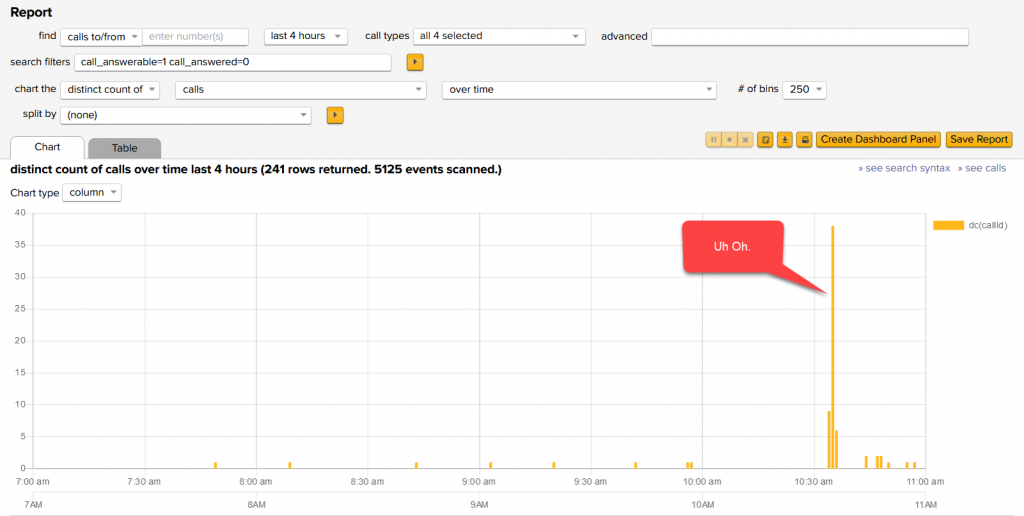
- First, add these fields to your Browse Calls page – call_answerable and call_answered
- In search filters, type in call_answerable=1 call_answered=0
- click » graph calls over time
- The search terms you added follow you over, but notice even without having changed anything else in here, I think there may have been a problem around 10:35 AM today…
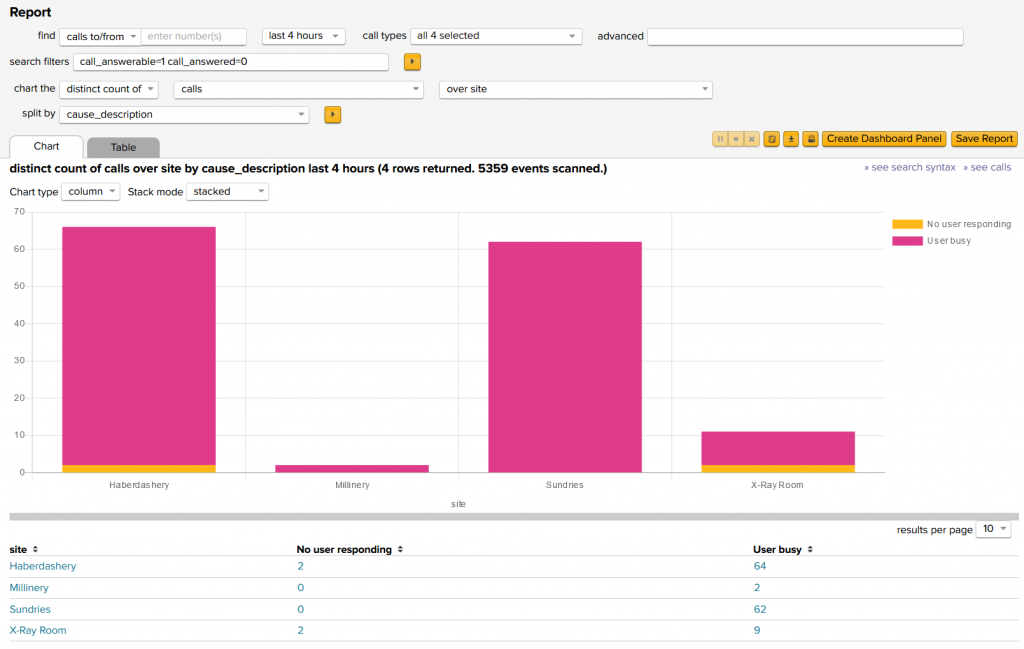
- With just a few tweaks –
- changed it to over site,
- split by cause_description
- I now have a per-site list of how many unanswered calls there were.


Depending on what you’ve got set up, other interesting ways to split this up might be:
over group, over subgroup, over site, over callingPartyCountry, … or pretty much anything else that makes sense in your data. Combine that with a split by of any of those as well.
Conclusion
I hope this helps find some interesting stuff.
As I mentioned, stay tuned because in the next week or so I’m going to create a blog specifically on building dashboards and making them useful.
Related
Great software ultimately has to empower you to achieve more in less time. This extends to the company behind it -- we have to remember to always use your time as efficiently as we can.
And here I am happy to say that we shortened our Product Overview video dramatically. The new one is only 4 minutes long, vs 11 for the old one. You can see it here:
NOTE: the old one showed more of the product and was definitely more complete. In fact this was deliberate because we used it both for new users and also to be a deeper onboarding video for everyday users. However it was a bit too long for anyone who just wanted the short version and didnt want to spend 11 minutes of their day.
February 1st, 2024