Cisco CDR
Lookin’ for Trouble
April 22nd, 2020
Sometimes you just need to find your problem spots. The most common request is for “failed calls”.
We have a lot of ways to find failed calls, but let’s start with some easy ones first! Most of these examples can be looked at in 15 seconds or less.
Failed Calls – by Gateways
Click Browse then Gateways.
If you are on the tab Summary you’ll see a field failedCallPercentage right there, per gateway.
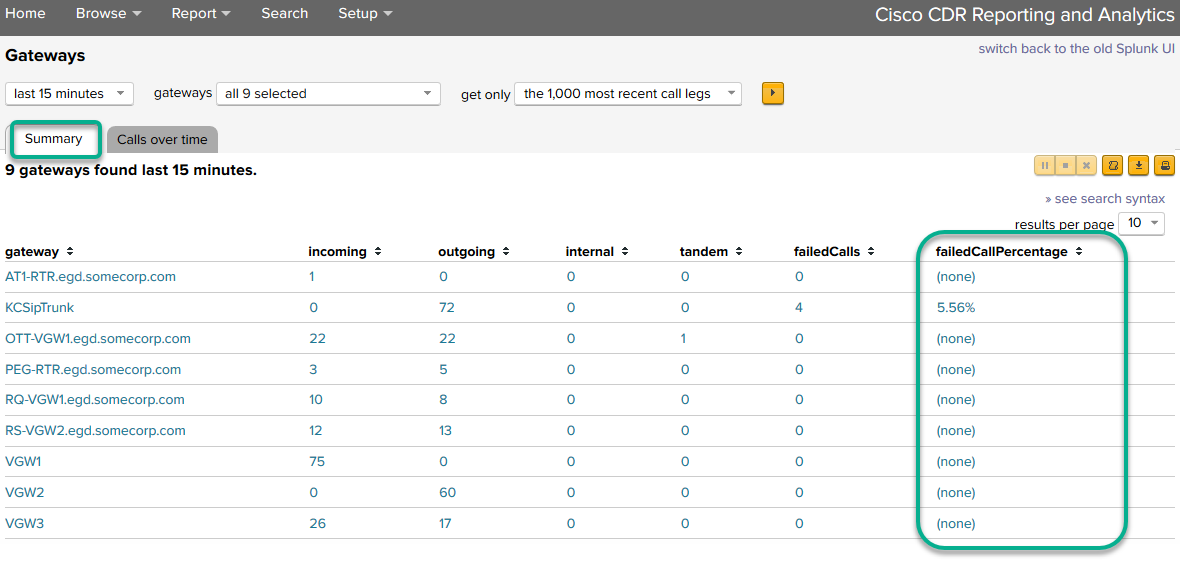
More details are available by clicking any row of interest.
Failed Calls – by Sites
Click Browse then Sites.
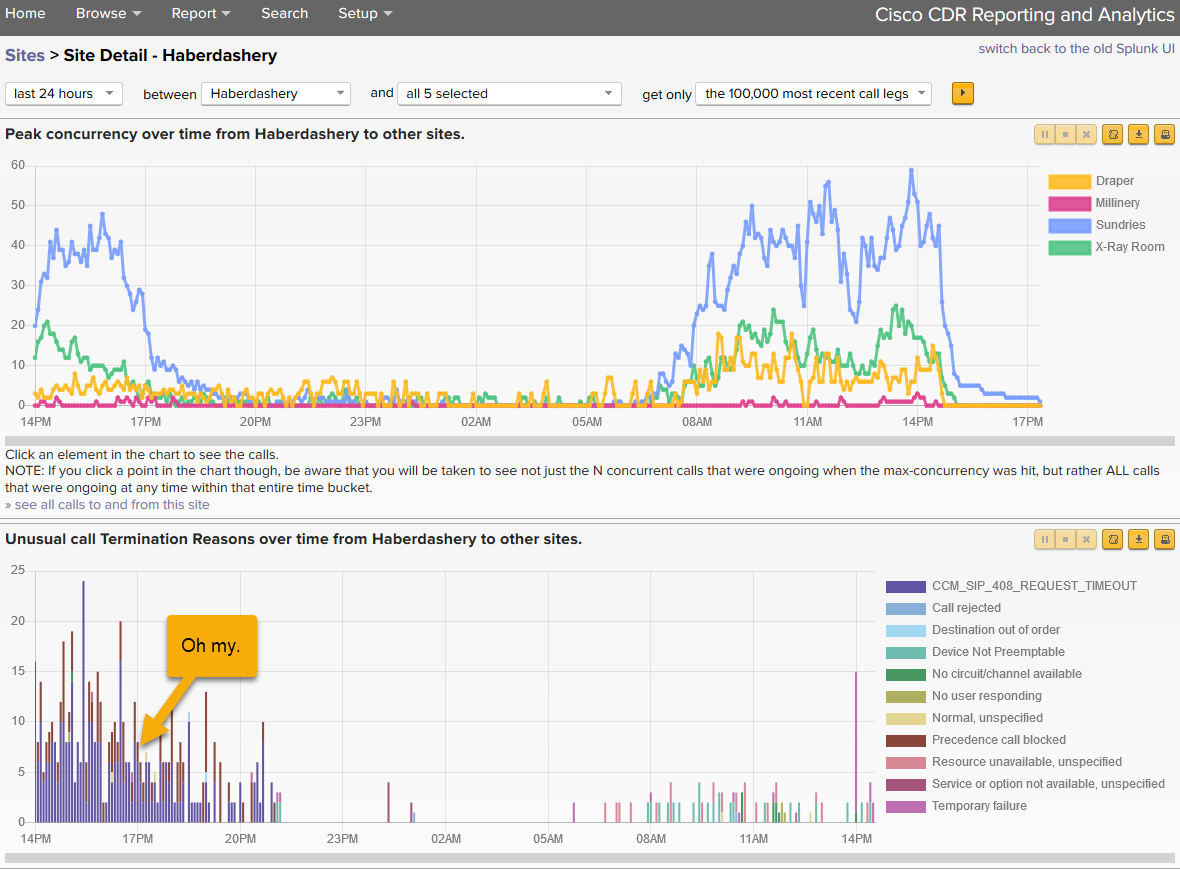
Pick a site, any site, and click on it! For instance, here I’ll click on my site Haberdashery
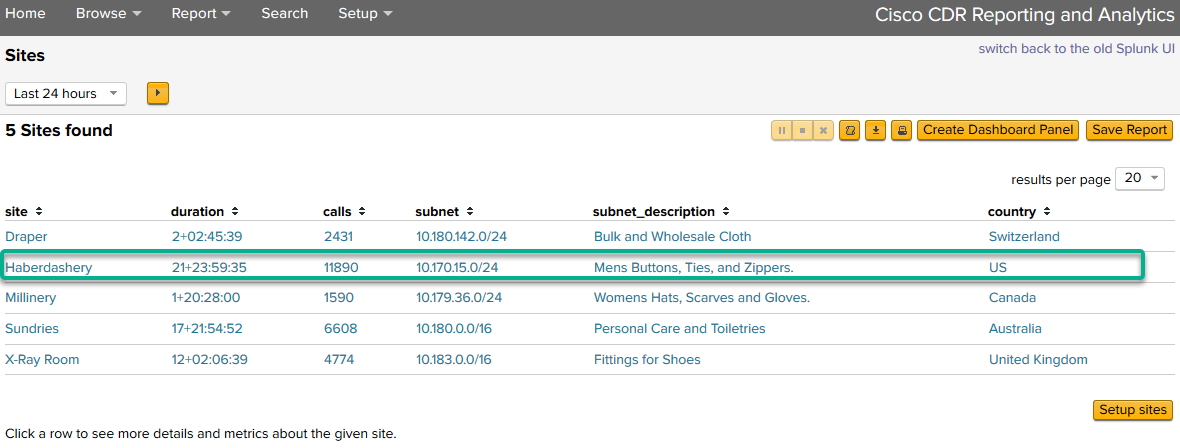
If you don’t have any sites set up, you can always add a few by clicking the button in the bottom right – “Setup sites” then see this link on how to get started with sites!
Anyway, if you’ll notice the bottom pane here, you’ll see it shows … Uh oh this site had a lot of CCM_SIP_408_REQUEST_TIMEOUT problems late yesterday!
Failed Calls – another subtly different view
Clicking Report then Call Concurrency and Gateway Utilization will get you a view of a specific *set* of failed calls – those that had no circuit or channel available for the call. See the bottom of this for an example!
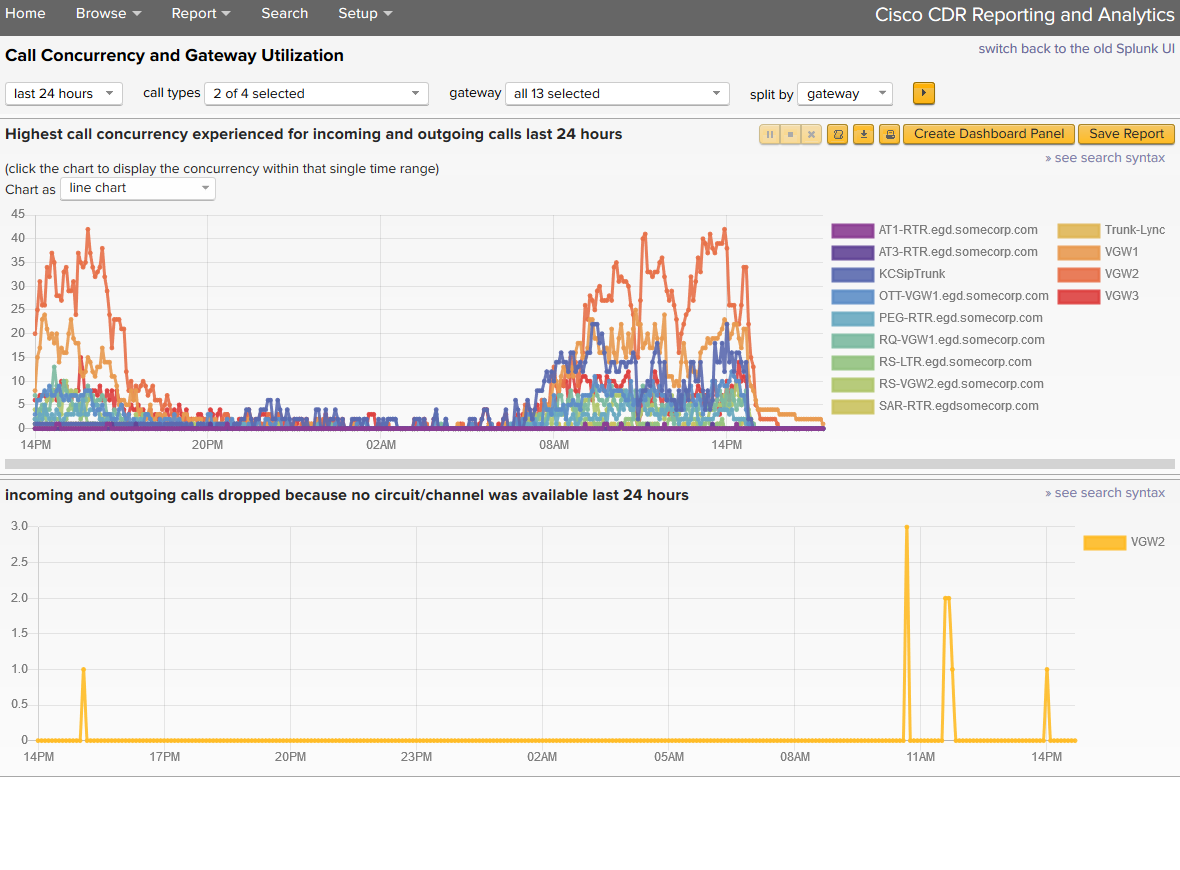
Don’t be afraid to click on things!
More specific ways
If you want to see failed calls more specifically, and maybe you have some special needs. Well, this also isn’t very hard.
Click Browse then Calls.
Edit Fields as appropriate to get at least the field cause_description displaying:
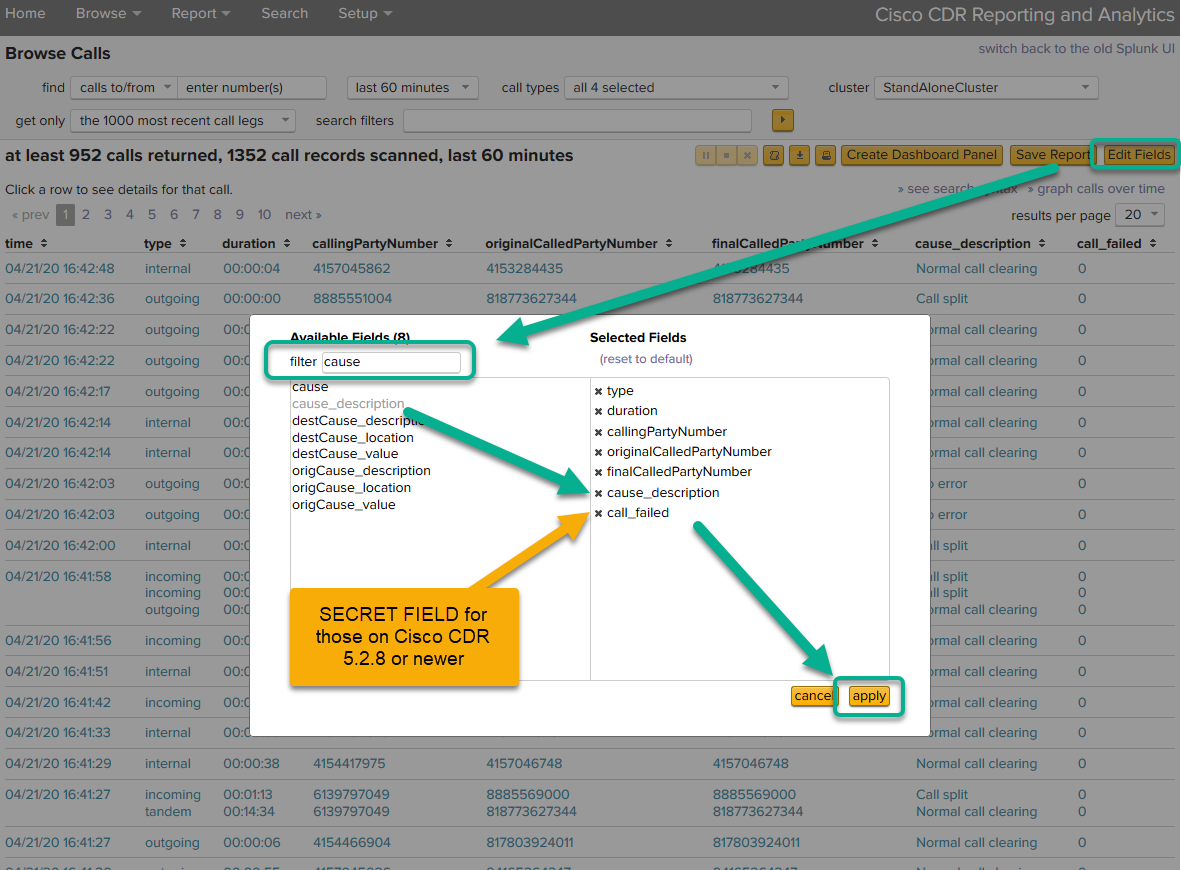
Did you see my secret field? If you are on the latest version of the Cisco CDR Reporting and Analytics app, you can use a shortcut field of call_failed. Ask your admins to update and keep going!
(Just click “Help” then “About” and at the bottom is your version. If you don’t have a “Help” menu in the upper right, try “Settings” and in THAT menu you’ll have a “Help” to click.)
Version 5.2.8 and newer users
5.2.8 users you can just add into the search filters box call_failed=1 and you are done. Press enter or click the search button, whichever is your favorite way to interact with the app.
This was super easy.
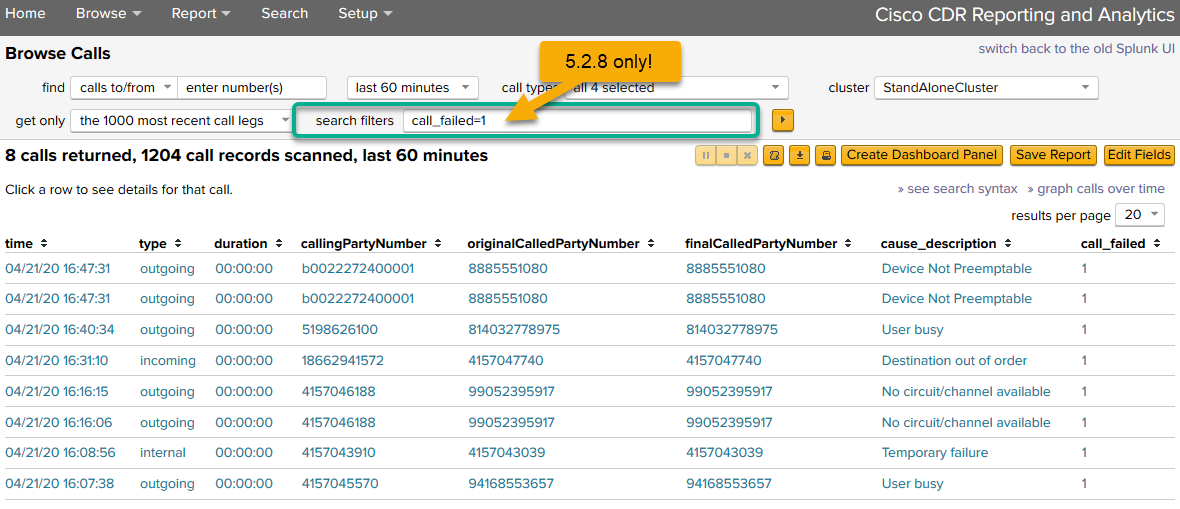
You can now skip past the next section!
Versions 5.2.7 and before
(This actually works on *all* versions, so if you need a particular set of filtering done that isn’t what we provide with the shortcut field, you can use these instructions to fine tune things)
See all those “Normal call clearing” cause_descriptions? They’re completely fine and not in error so let’s get rid of them.
So into the search filters field type NOT cause_description="Normal call clearing" and press enter (or click the search button, whichever makes you happy).
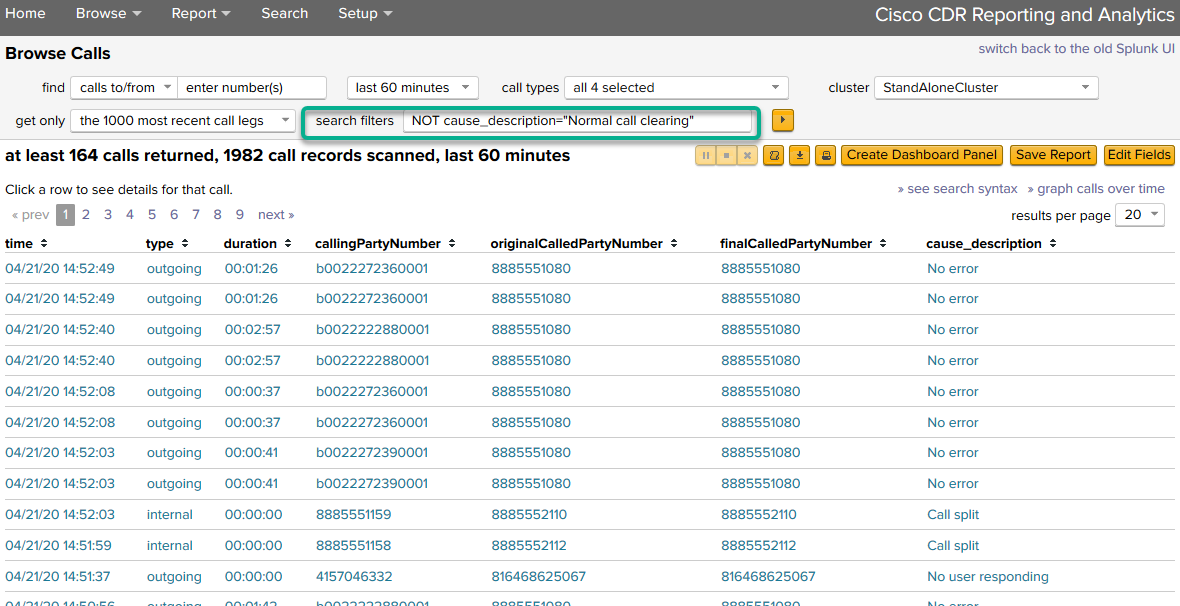
That’s better, but we still have a lot of “No error” and “Call split” to deal with, so let’s get rid of both of them. You can add them to the end of your existing search filter so that it says NOT cause_description="Normal call clearing" NOT cause_description="No error" NOT cause_description="Call split".
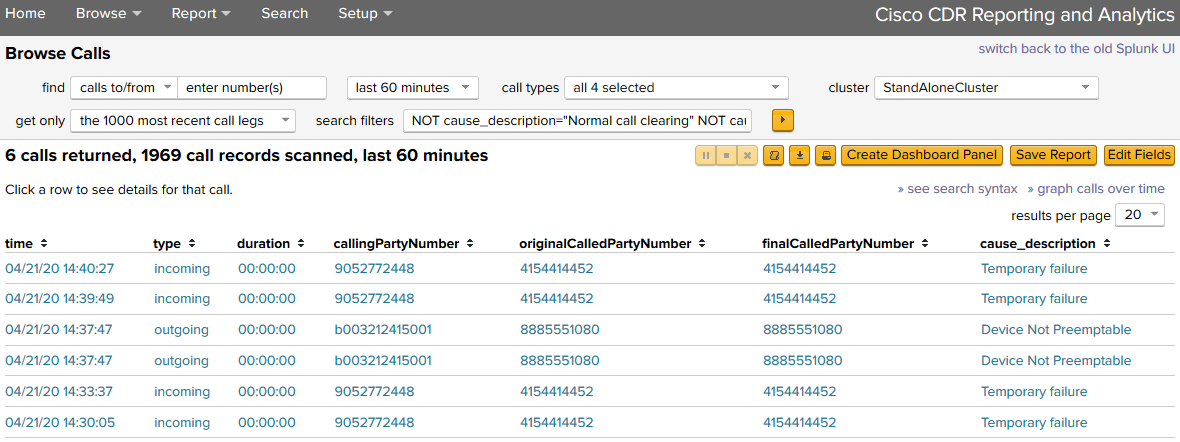
Well, that leaves a few yet to get rid of because it seems like “No user responding” isn’t really an error either (of course, that depends on exactly what you are looking for, doesn’t it?). I also don’t want “User busy” or “Unallocated (unassigned) number” so I’ll add those as well. By repeating this until you’ve removed all the ones you don’t want to report on, you’ll soon have a list of just the calls you’d like to be highlighted. Here’s my final search filter from all that:
NOT cause_description="Normal call clearing" NOT cause_description="No error" NOT cause_description="Call split" NOT cause_description="No user responding" NOT cause_description="User busy" NOT cause_description="Unallocated (unassigned) number"
See below for what it should end up looking like!
All versions continue here!
Here’s what you should end up with, regardless if you used the newer method or the older method:
From here, you could click Create Dashboard Panel or Save Report to save this page off as it is as a list.
Or you could click the link under those buttons, graph calls over time which takes you into General Report into a call volume over time report. From here, click around the options – what’s of interest to you? I will only provide a screenshot for a few of these, but here’s a few options to try:
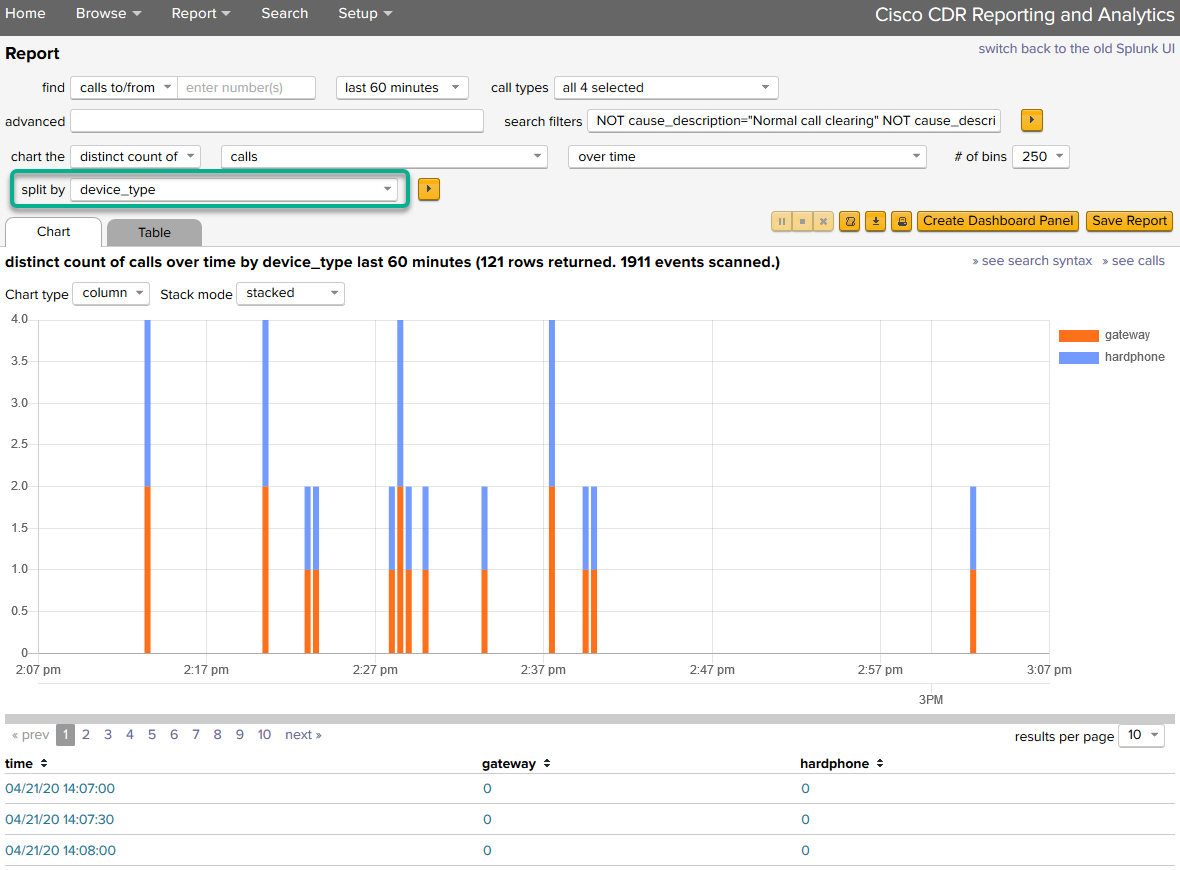
To see a time series of failed calls by type of device:
Change the split by (none) to split by device_type to get a timechart with columns split by the device types involved.
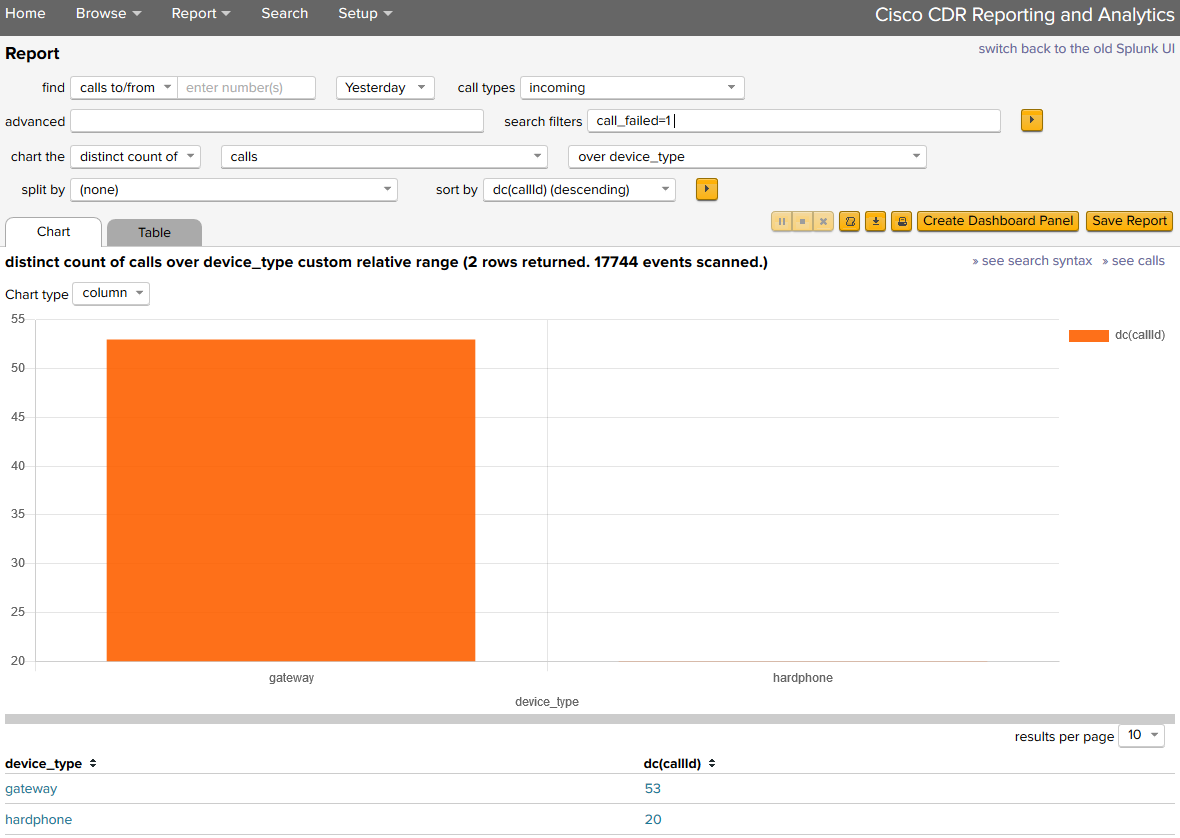
To see a count of failed calls by type of device:
Change back to split by (none) if you have it set differently, then change the drop-down for over time to over device_type.
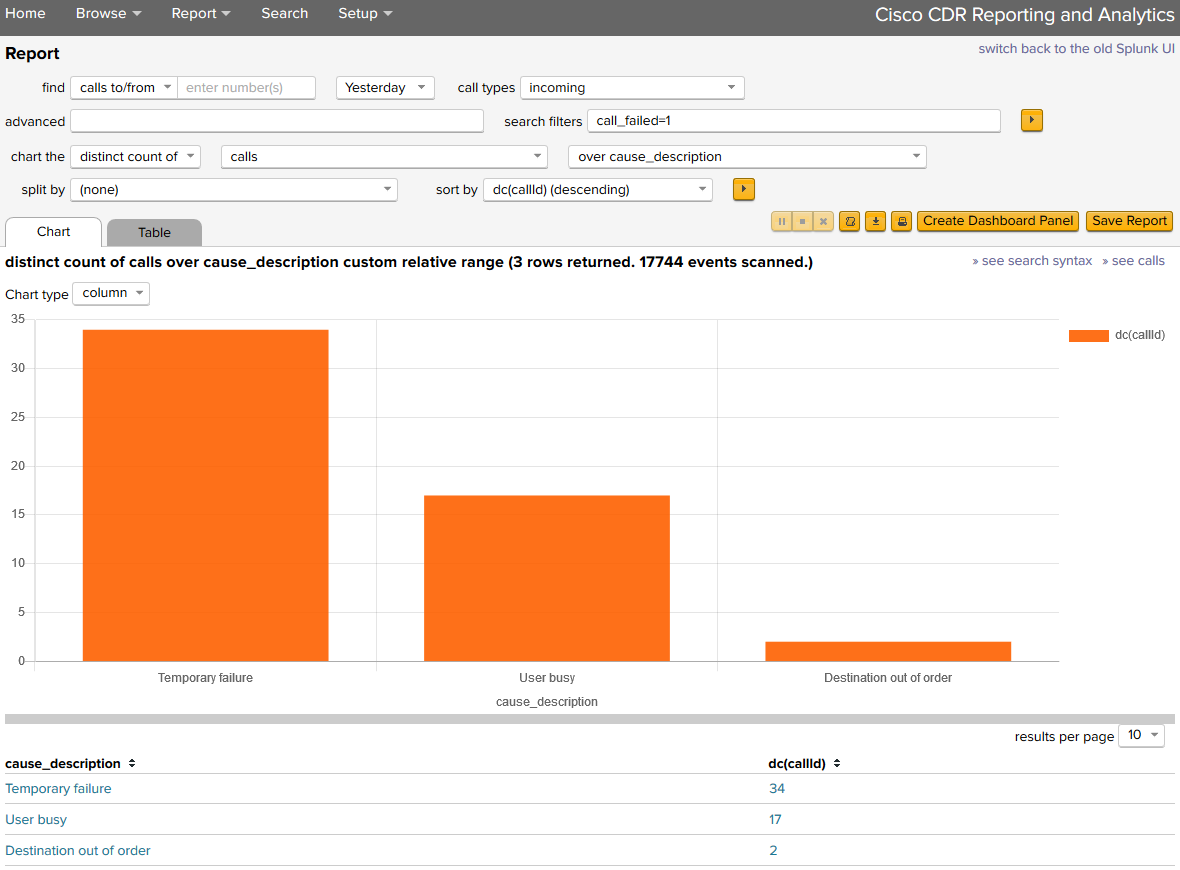
For a list of failures.
For a list of the failures themselves, try over cause_description.
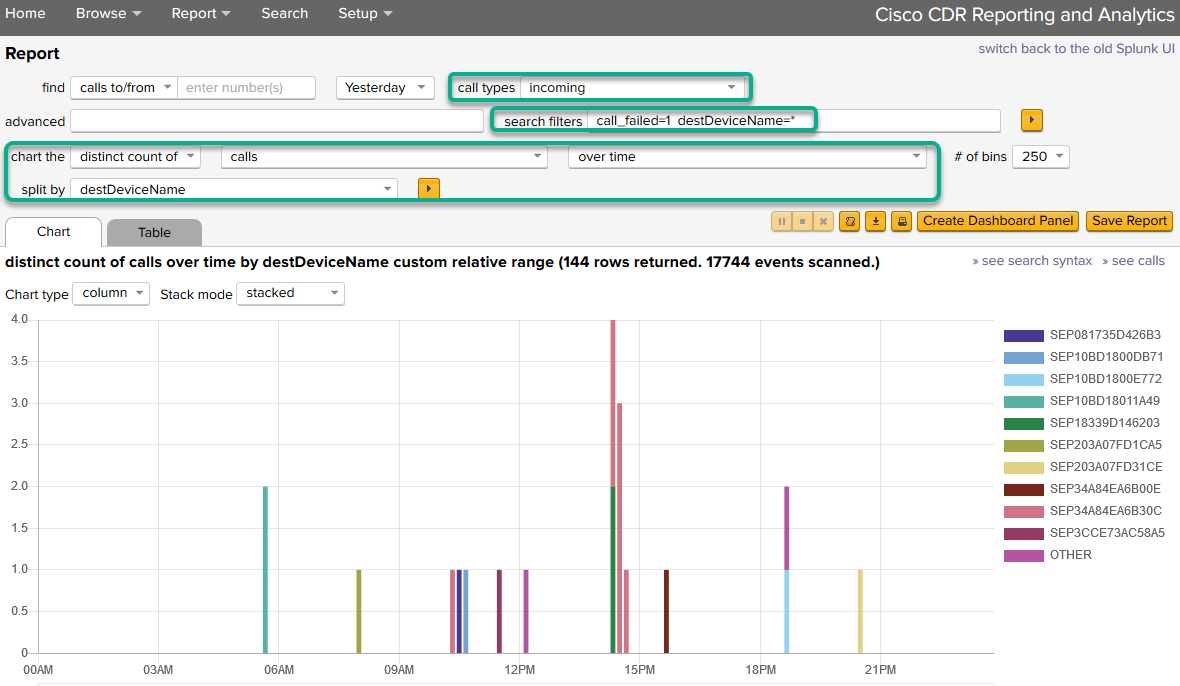
Hunting for specific problematic devices.
Are there any patterns in specific non-gateways having problems (In other words, is Jane’s internet connection so terrible that her Jabber client keeps failing to receive calls?)
- Try setting the call types to incoming,
- A search filter of two items –
call_failed=1 destDeviceName=*(Try it both with and without that destDeviceName=* in it; with it in we trim out all the “null” values where the inbound call never made it far enough to even *have* a destDeviceName). - Then do the distinct count of calls, over time and split by destDeviceName.
Other things
This is a general purpose reporting UI and you can do some crazy things in it. Just click around, try stuff. Some might work out well, others … not so much. It’s ok, no one’s watching!
Conclusion
I hope this gets you started on finding problem areas – gateways, sites, devices, or just general failures.
In the next few days I’m going to write a followup, looking for even more trouble. This will be a bit more custom, but maybe that’s exactly what you need. Watch for it!
Related
Great software ultimately has to empower you to achieve more in less time. This extends to the company behind it -- we have to remember to always use your time as efficiently as we can.
And here I am happy to say that we shortened our Product Overview video dramatically. The new one is only 4 minutes long, vs 11 for the old one. You can see it here:
NOTE: the old one showed more of the product and was definitely more complete. In fact this was deliberate because we used it both for new users and also to be a deeper onboarding video for everyday users. However it was a bit too long for anyone who just wanted the short version and didnt want to spend 11 minutes of their day.
February 1st, 2024