Cisco CDR
Custom Maps – 3, Converting Your Map Into a Choropleth Map
March 15th, 2019
Imagine plotting your printer error count directly on a floorplan, or dropping count of failed backups on a campus map so you know which locations are having problems!
If you were to search for “Splunk custom map”, you might find as I have that the only customizations they talk about involve just putting *your* data on *existing* maps.
While this is useful, sometimes you need your own image used as a map. While looking, I found a couple of almost-solutions but nothing that solved the whole problem. It turns out that a large portion of this problem isn’t a “Splunk” problem, but will involve other products to build the maps themselves, so I decided to write this quick tutorial on how to build a map.
Having visited Washington D.C. a short time ago (for Splunk .conf 2018), I decided to try to make my own map out of an image I found on the internet of the national mall. I wanted this to consist of my own custom “map” that I could place in a dashboard in Splunk, and have data be populated into it just like any other map. The techniques here should apply to anything from a campus map to a floorplan.
The steps involved are (Current Step Highlighted below)
- Create a map out of your own image.
- If you can’t yet see your map “inside Splunk”, then hop back to the beginning of this set of posts and convert your image into a usable map.
- Make that map show up inside Splunk and use it in a cluster map visualization
- If you already have map tiles but haven’t made them visible and usable in Splunk, you should see our previous post!
- Turn your existing map into a Choropleth map and use it as a choropleth map visualization
- This particular blog post is about this.
- This can stand alone, too – if you want to use a built-in map and just need your own Choropleth shapes, you can start here.
Install Shapester
I won’t belabor this with great detail, but you need to in your Splunk install the app Shapester. Steps may vary, but here’s a set that should work.
- Browse to the splunkbase app Shapester, click the green button to download (or login to download, depending if you are logged in or not already).
- Save the file somewhere you can find it again later. Note it’s file name, too.
- Log into your own Splunk install.
- To the right of the splunk>enterprise logo in the upper left, click the Apps pulldown and select Manage apps.
- On the right click the button Install app from file
- Browse to your previously saved file, click the Upload button, follow the prompts.
Edit Shapester’s source to let you use your own tileset
Note – if you are just here to build a Choropleth map on top of any of the existing tilesets (see below), then you don’t need to add your custom tileset in. You can instead just … build it on top of the tilesets that already exist inside Shapester.
But, if you are here in a continuation of our series …
If you change to the app Shapester, you’ll see a map of the world. In the upper right there is a “tileset” loader “button”.
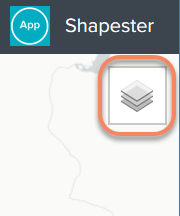
When you click it, the following menu appears.
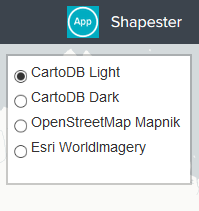
While that menu includes some great tiles, it doesn’t include yours so we’ll have to add it.
This will involve editing a little bit of javascript, but as you’ll see it’s not real hard. The hardest part is finding the right place to make the change!
- Open, in the editor of your choice and appropriate to your operating system, the following file
$SPLUNKHOME/etc/apps/geoshapester/appserver/static/components/map/map.js- On windows, it’s likely to be something like C:\Program Files\Splunk\etc\apps\geoshapester\appserver\static\components\map\map.js
- On my Linux install it’s /opt/splunk/etc/apps/geoshapester/appserver/static/components/map/map.js
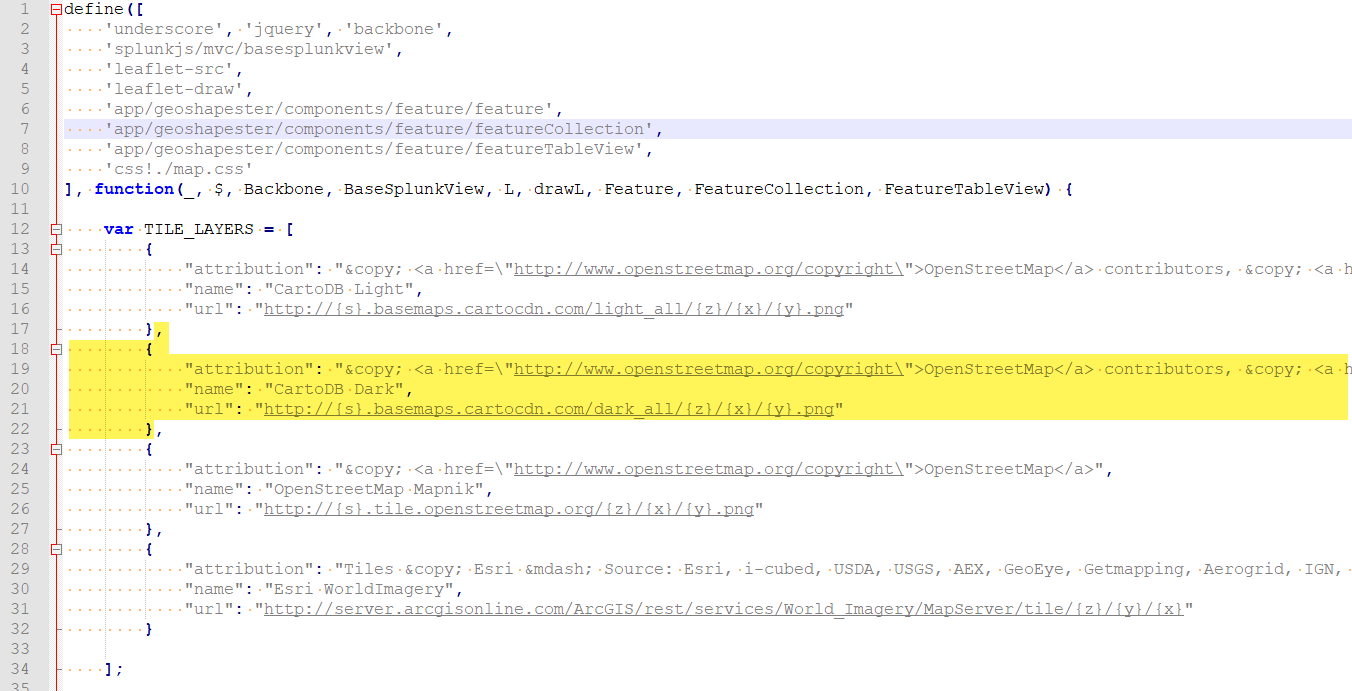
- Near the top is a section called “TILE_LAYERS” and you’ll see it has those 4 items listed. I have one entry highlighted in the below screenshot.
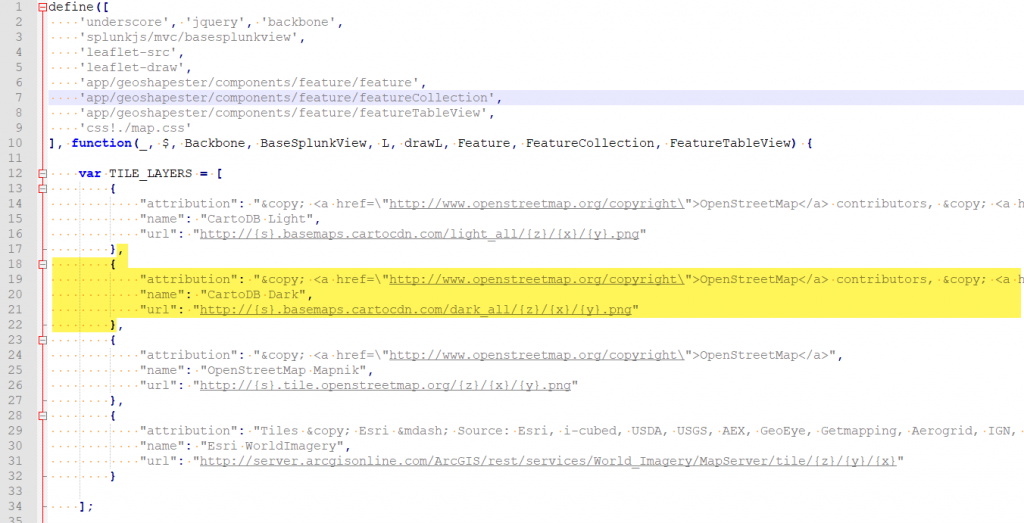
(Note – I’m using Notepad++. Editpad is also a good editor for Windows. I’ve heard Sublime is a good one for a Mac. In Linux I just use VIM, but I know it’s pretty scary to a lot of people. in any case, please don’t use the built-in Windows “Notepad” editor. It’s terrible.) - Following the formatting carefully, add a new entry like the following for your own map:
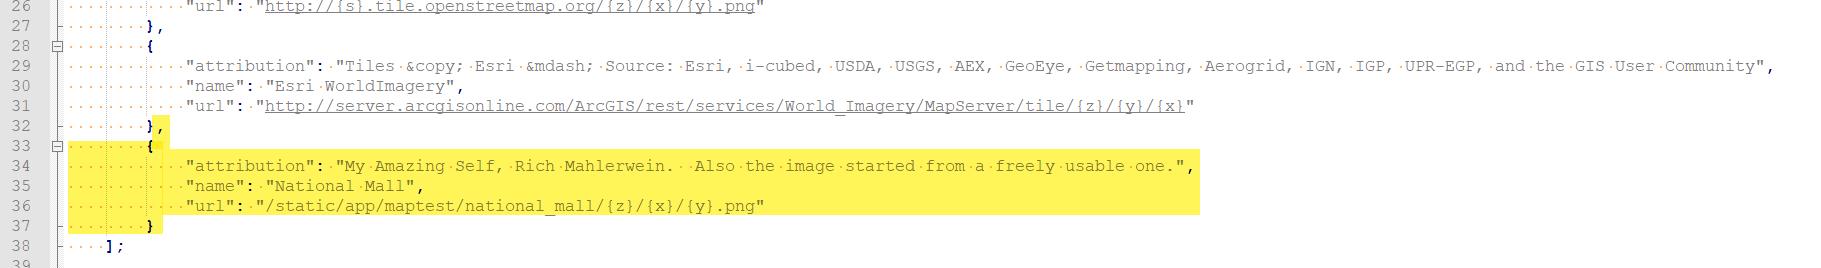
{ "attribution": "My Amazing Self, Rich Mahlerwein. Also the image started from a freely usable one.", "name": "National Mall", "url": "/static/app/maptest/national_mall/{z}/{x}/{y}.png" }- Make sure you add the comma after the last entry, before adding yours below it!
- Be careful of quotes and commas inside the curly braces.
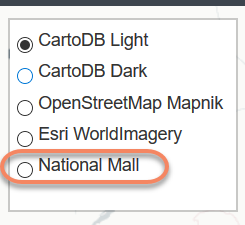
- It’ll look like this when you are done.

- Save that file.
- A Splunk restart MAY make this show up, but Splunk and your browser has a tendency to cache too aggressively. To get around this, hit your _bump endpoint.
- Look up at your Splunk url.
- Erase everything after the locale (“en-US” or whatever yours is) and after it add /_bump
Like http://localhost:8000/en-US/_bump - You’ll see a page with a Bump version button. Click it.
- Then click Back in your browser twice to get back to where you used to be, the Shapester app
- NOW when Splunk hits that page, it knows that even the javascript files under it need to be loaded afresh…
- Now you can see your tiles in the list!
- BUT – you can’t just click it because your zoom level is wrong! Easily fixed, though.
- Making sure to stay on one of the “other” tileset options, click around and zoom in until you are close enough in the right place that your map should show up.
- Once you have it zoomed in far enough and in the right place, THEN you can change to your own tileset.

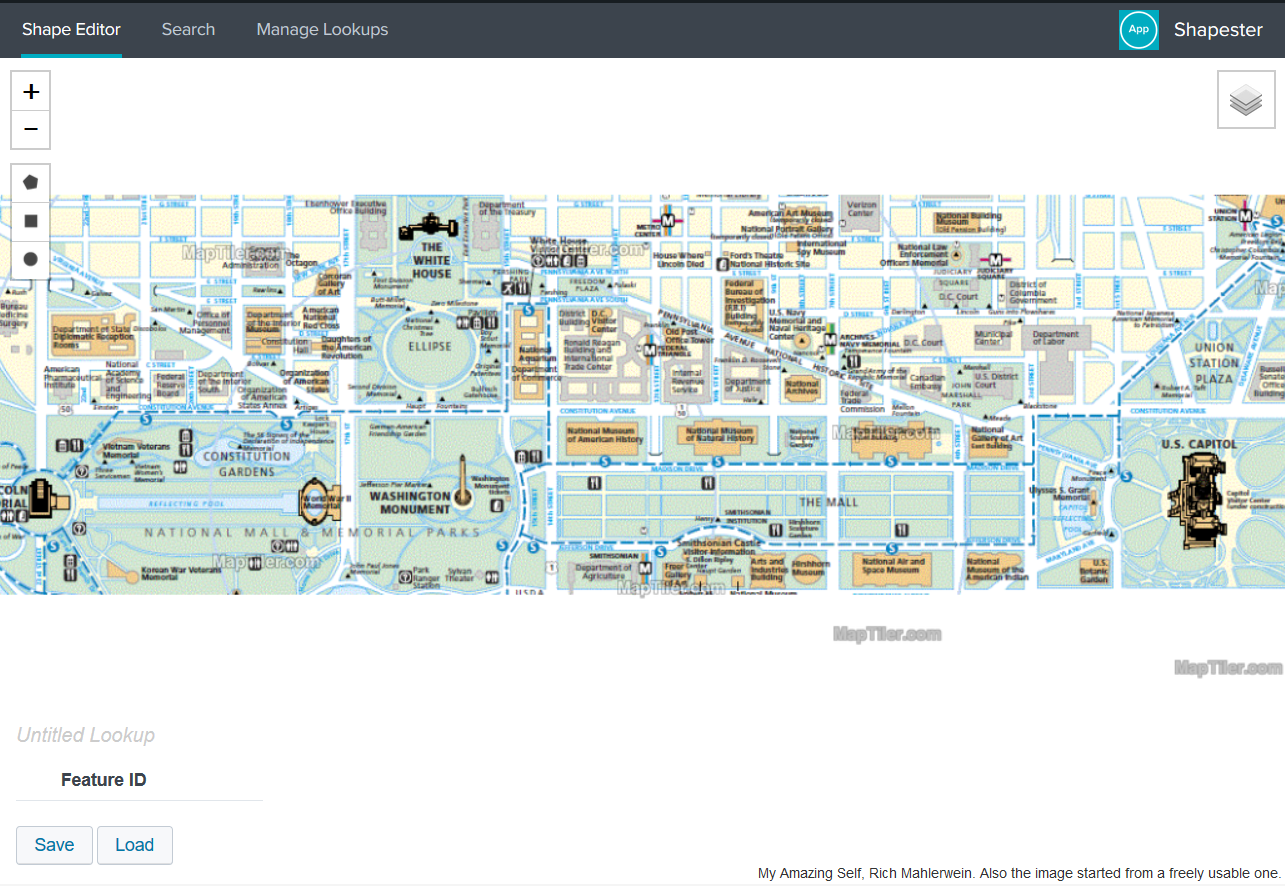
Making Shapes
Now that we have our map showing up so we can edit it, let’s make some shapes on it!
(If you were just using a built in map, then I guess the above statement still applies to you too!)
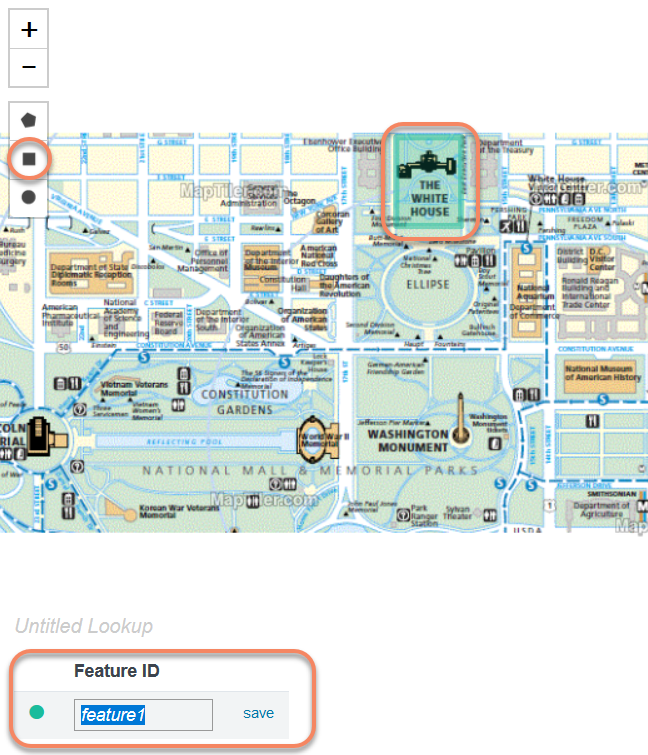
Using the toolbar on the left, I’m going to draw a square on top of the White House. So,
- click the “draw square” button,
- click and drag around the area I want to make a green box on it,
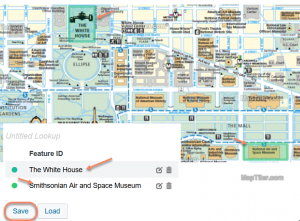
- and the moment I finish that click and drag you’ll see it’s asking me at the bottom to name it

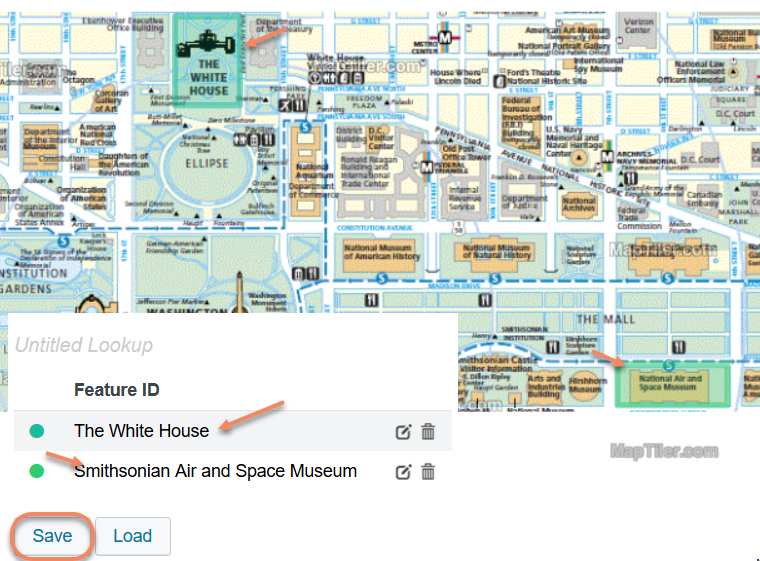
So I type in “The White House” and click the tiny save link next to it. - Repeat that process with “Smithsonian Air and Space Museum”
- Once both are in place, I can now saved the lookup itself (which is currently, temporarily, named “Untitled Lookup”) by clicking the Save button at the bottom.
- The dialog that pops up asks for a name, and if you’ll notice prepends the whole name with geo_. Let’s name ours national_mall
That should be it for this part! Next step is to change permissions so that we can use this lookup in another app.
Change permissions on the lookups
First, we need to make the lookup we just created available to our own app. There are many ways to do this, the two I’d recommend is either changing permissions on the lookup so it’s available everywhere, an exercise I document below, or you can just clone it from the shapester app into your own, an exercise will leave to the reader if you wanted to do this instead.
Note we have to make this change in two closely related places, so if the directions feel like they’re nearly repeating themselves, it’s because they are.
- While you are still in the shapester app, WAY up in the Splunk menu click the Settings pull-down and click Lookups
- Click the Lookup table files link
- Find the lookup we just created, geo_national_mall.kmz
- Click the Permissions link under the column Sharing
- Change it so Object should appear in says All apps and save that.
- Again way up in the Splunk menu click the Settings pull-down and click Lookups
- Click the Lookup definitions link
- NOTICE that was a different link than the first time through!
- Find the lookup definition, geo_national_mall
- Click the Permissions link under the column Sharing
- Change it so Object should appear in says All apps and save that.
Now this lookup will be available in all apps on your Splunk server.
Use the new Choropleth map
Now for the exciting part!
Change back to your own app where your map exists.
For the continuation of this example, I’m going to start with my search from the previous posts which uses makeresults to fake up a single event. In your case, use a search that returns those locations.
| makeresults | eval myLocation="Smithsonian Air and Space Museum"
That returns a single event with a _time of now and myLocation set to the Air and Space Museum. Your search will be different (though you can use this technique for testing), and it should return data with items like what you named your map sections. For this particular case, we’ll also eval a count field, which is the hard-coded “what values encode the color of the choropleth map” field. You’ll see that below in my examples.
For Choropleth maps, the “lookup” portion is done with the geom command. There’s some great documentation and examples on Splunk’s page for geom, so if you get stuck or want more information I suggest checking that out.
For our needs, we’re going to need to tell the geom command what the featureId field is in our data. This is so that it knows what field in OUR data maps to the field the map uses.
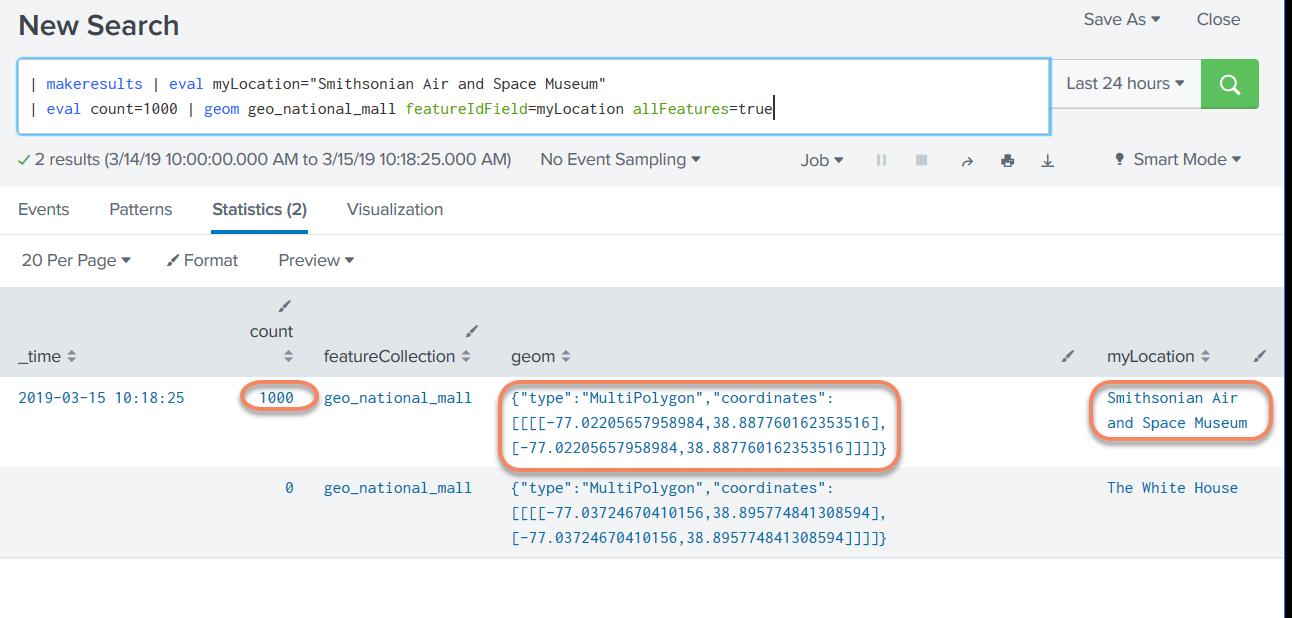
| makeresults | eval myLocation="Smithsonian Air and Space Museum"
| eval count=1000 | geom geo_national_mall featureIdField=myLocation allFeatures=true
Now, switch to the tab Statistics and confirm you see geom data – this is our test that the lookups we created are correct.
Now, an “almost-repeat” of the steps from previous posts to change to a Choropleth map, and change the tileset to our own.
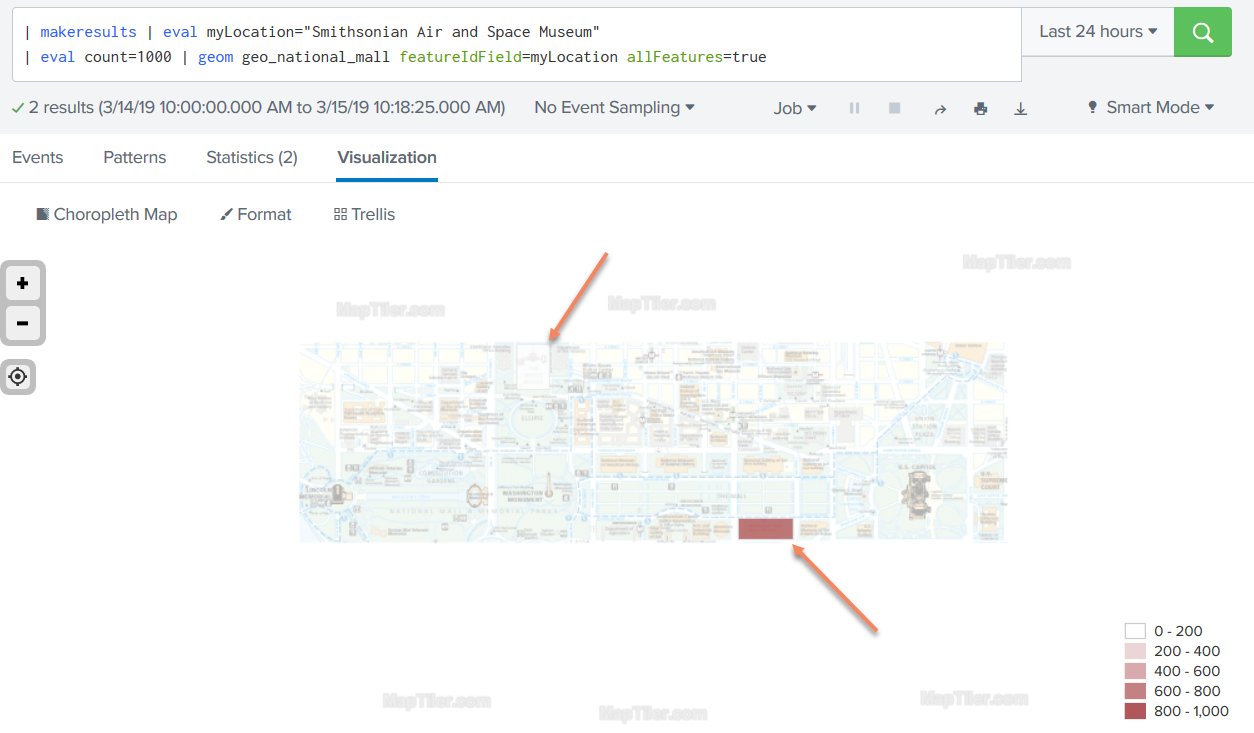
- Change to the Visualizations tab
- Change the visualization to Choropleth Map
- Zoom in (perhaps changing it to the openstreetmap.org tiles so you can zoom in far enough, like we did before)
- Click the Format button on the visualization
- Select subsection Tiles
- In the URL put in /static/app/appname/<mymaptilefoldername>/{z}/{x}/{y}.png
- In my test case, /static/app/appname/national_mall/{z}/{x}/{y}.png
- Change Max Zoom and Min Zoom to your Min/Max zoom levels that we noted before (12 and 15 for this particular example)
- ALSO I recommend here changing the Tile Opacity from 100% down to something like 30%, especially if your map is “busy” and has lots of color.
- Click the “X” on the format menu to close it.
And that’s it! While not amazing in MY test case, you can see how both show up. From here, there are all sorts of settings you can play with to change colors, ranges,
In Closing
I know this has been a rather long road, but I’m glad you stuck with me until the end.
I’ve love feedback on this process, or to see any of you own maps you’ve come up with!
Send ’em in to mapping@sideviewapps.com
Related
Great software ultimately has to empower you to achieve more in less time. This extends to the company behind it -- we have to remember to always use your time as efficiently as we can.
And here I am happy to say that we shortened our Product Overview video dramatically. The new one is only 4 minutes long, vs 11 for the old one. You can see it here:
NOTE: the old one showed more of the product and was definitely more complete. In fact this was deliberate because we used it both for new users and also to be a deeper onboarding video for everyday users. However it was a bit too long for anyone who just wanted the short version and didnt want to spend 11 minutes of their day.
February 1st, 2024