Cisco CDR
Maps!
August 10th, 2018
The question
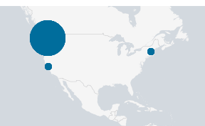
Have you ever wondered where your inbound calls come from? Do you suspect agents are placing a lot of calls on the company dime to Loja, Ecuador to find out if the high temp there is supposed to be 74F again today?
Well, you are in luck! Today we’ll show you how to display the call counts in a Cluster Map!
Finding some data
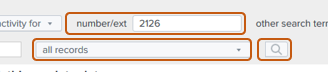
First, let’s find the data you want to display. This could be a lot of things, but for now let’s use your own main extension, let’s say it’s “2126”.
- Browse > Browse Calls.
- In the number/ext field, type in 2126.
- Change the “scan only the last 1000 records” to “all records”.
- Click the search icon.
There’s no reason you have to use your main extension – you could leave all these options blank and see all the calls that end up with location information in them. The sky is the limit here.
Adding latitude/longitude fields
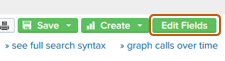
- Once you have calls showing up, way over on the right click the green “Edit Fields” button.
- Search for keyword “lat” and in the resulting list, click on the green arrow to add the fields “callingPartyLat” and “finalCalledPartyLat” to the right side.
- Do the same for “long”, adding “callingPartyLong” and “finalCalledPartyLong”.
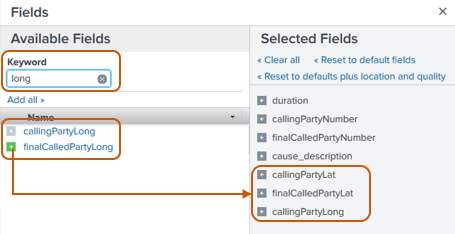
- Once you have all four fields added, click the Save button.
Change to showing raw data
Now that you have some useful, specific data, we need to display this data in the core Splunk UI to do some custom visualizations.
- Click the link to “» see full search syntax” in the upper right.
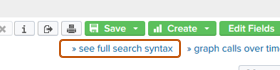
- A “New Search” window will open with a big long search already populated.
Don’t fret if it just looks like a bunch of gobbledygook – we already did the hard work for you so you just have to add a few small commands to the very end of it.
Add the magic commands
- To the end of that search, paste in
| geostats latfield=callingPartyLat longfield=callingPartyLong count
- The result should look like this:
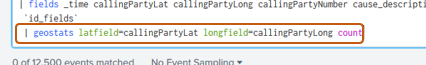
- Then click the search button (or just press enter while your cursor is in the search text field).
This runs the geostats command, telling it to plot the ‘count’ for each latitude and longitude. We have to tell the command which fields in our data contain the latitude and longitude, hence the “latfield=<my latitude field name> longfield=<my longitude field name>” in the middle.
Make it pretty
- Change to the “Visualization” tab.
If Splunk is already displaying a Cluster Map, there’s nothing else you need to do except wait a few moments for the data to populate.
If on the other hand you do not have a Cluster Map showing,
- Click the Visualization tab, then the Visualization type.
- Change it to Cluster Map. This should be under the “Recommended” section. If not, look farther down.
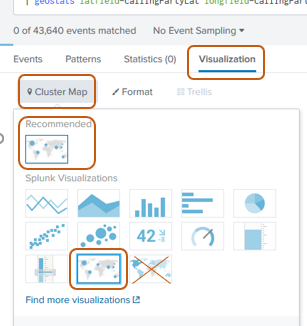
Note there are two “Maps” style visualization. The other one (with shaded countries instead of dots) is called a Choropleth Map. We don’t have the right data in this example for the Choropleth map, so be sure not to pick that one. If you did want a choropleth map, we’ve done a blog on that too, see “Choropleth maps!”
And that’s it, you should now have a map populated with the call counts.

Some minor variations
Display outbound call destinations instead of inbound call sources
To change from plotting the incoming calls’ location to the location of the outgoing, use fields ‘finalCalledPartyLat’ and ‘finalCalledPartyLong’.
| geostats latfield=finalCalledPartyLat longfield=finalCalledPartyLong count
Counting by the final disposition of the call
If you want your little dots to be something other than one single color, an option may be to count BY something. One of the more popular ‘by’ clauses is by the field “cause_description”. The field “cause_description” contains values like “Normal call clearing” (which is a call that ended normally), “Call split” (which is when a call gets transferred), “No answer from user (user notified)” which should be self explanatory, or maybe even the dreaded “No circuit/channel available” which means that you have filled your pipes and couldn’t get a free line to place a call with.
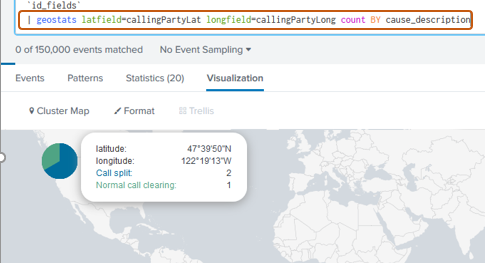
Anyway, enough description – adding the BY clause is easy. To the end of either one of the above, simply add ‘ BY cause_description’. So if you were doing the final called party version, it would now be
| geostats latfield=finalCalledPartyLat longfield=finalCalledPartyLong count BY cause_description
Now when you click search, your little blue dots should now be divided up into little slices for different cause descriptions. Hold your mouse over them to see more detail.
Related
Great software ultimately has to empower you to achieve more in less time. This extends to the company behind it -- we have to remember to always use your time as efficiently as we can.
And here I am happy to say that we shortened our Product Overview video dramatically. The new one is only 4 minutes long, vs 11 for the old one. You can see it here:
NOTE: the old one showed more of the product and was definitely more complete. In fact this was deliberate because we used it both for new users and also to be a deeper onboarding video for everyday users. However it was a bit too long for anyone who just wanted the short version and didnt want to spend 11 minutes of their day.
February 1st, 2024