Cisco CDR
Lookin’ for Troublesome Jabber Calls
May 8th, 2020
When it comes to Jabber, softphone and other calls that are being placed from people’s homes instead of from in your building, the old tried and true method of slicing and dicing by gateways isn’t as useful as it is with the more deterministic quality of desk phones in an internal network.
Finding Jabber calls
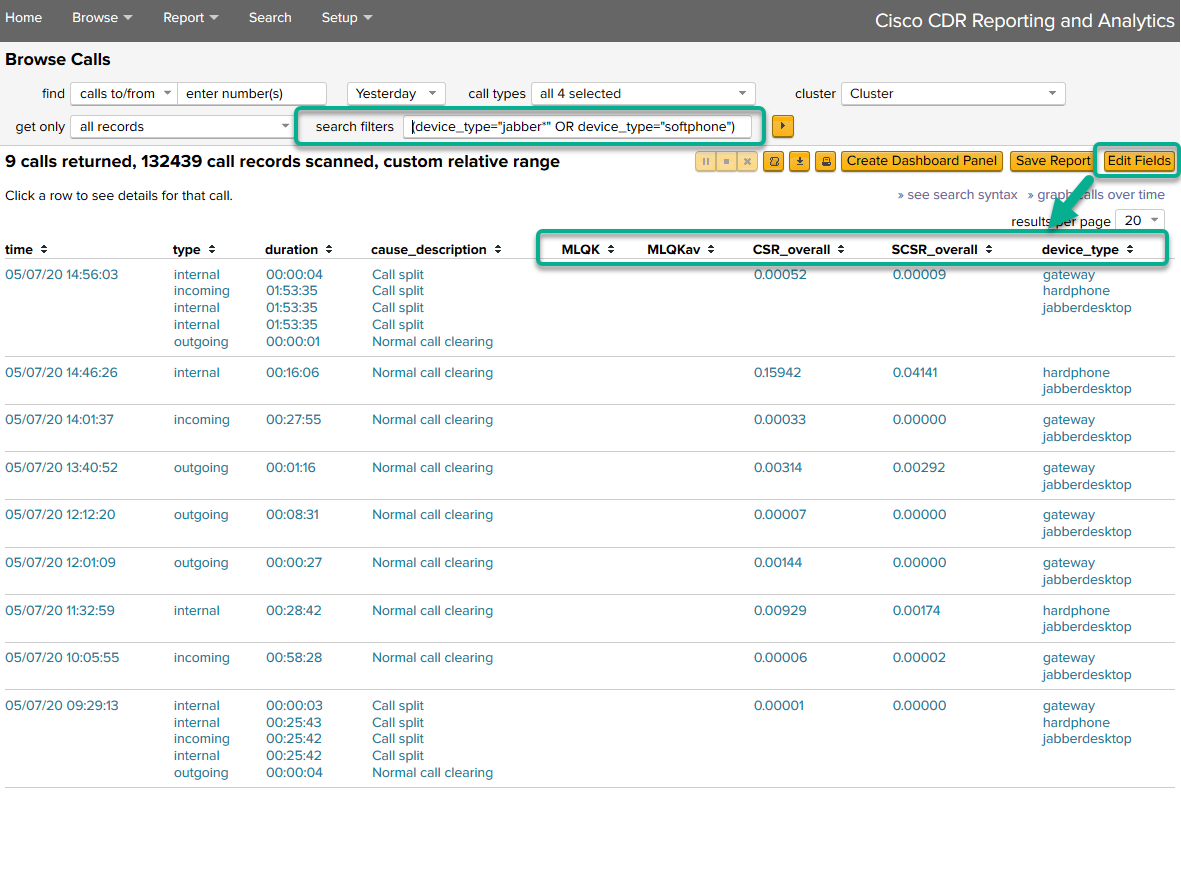
Jabber calls are relatively easy to find: put device_type="jabberdesktop" into your search filters. If you want all jabber devices at once, and include softphones too, try (device_type="jabber*" OR device_type="softphone")
Add in whatever of the CS and SCS fields you need. Here I added CSR_overall, SCSR_overall. I already had MLQK and MLQKav in there along with device_type, so I juust rearranged them a bit in the field picker by dragging them around. Do note that as far as I can tell Jabber clients don’t report MLQK, only the CS fields. And then not always – if someone knows the definitive answer on getting jabber clients to always send this information in, I’d love to hear about it – email me at docs@sideviewapps.com!
Reporting on the call quality
From the above, click “» graph calls over time” (If you don’t know where that link is, in the above screenshot it’s underneath the green arrow near the upper right. Also in that case, you should watch our Core UI Overview video!)
Now, don’t be alarmed that it’s showing a call volume report. This is just the default and we’ll fix that shortly.
Change it to chart the average of CSR_overall and over user. Do note this then filters out all softphones that were in use when no one was logged into them. Which I’m not a voice expert but it seems to me that they don’t work unless someone’s logged in so this should be fine.
There’s a sort by field if you’d like to arrange it slightly differently.
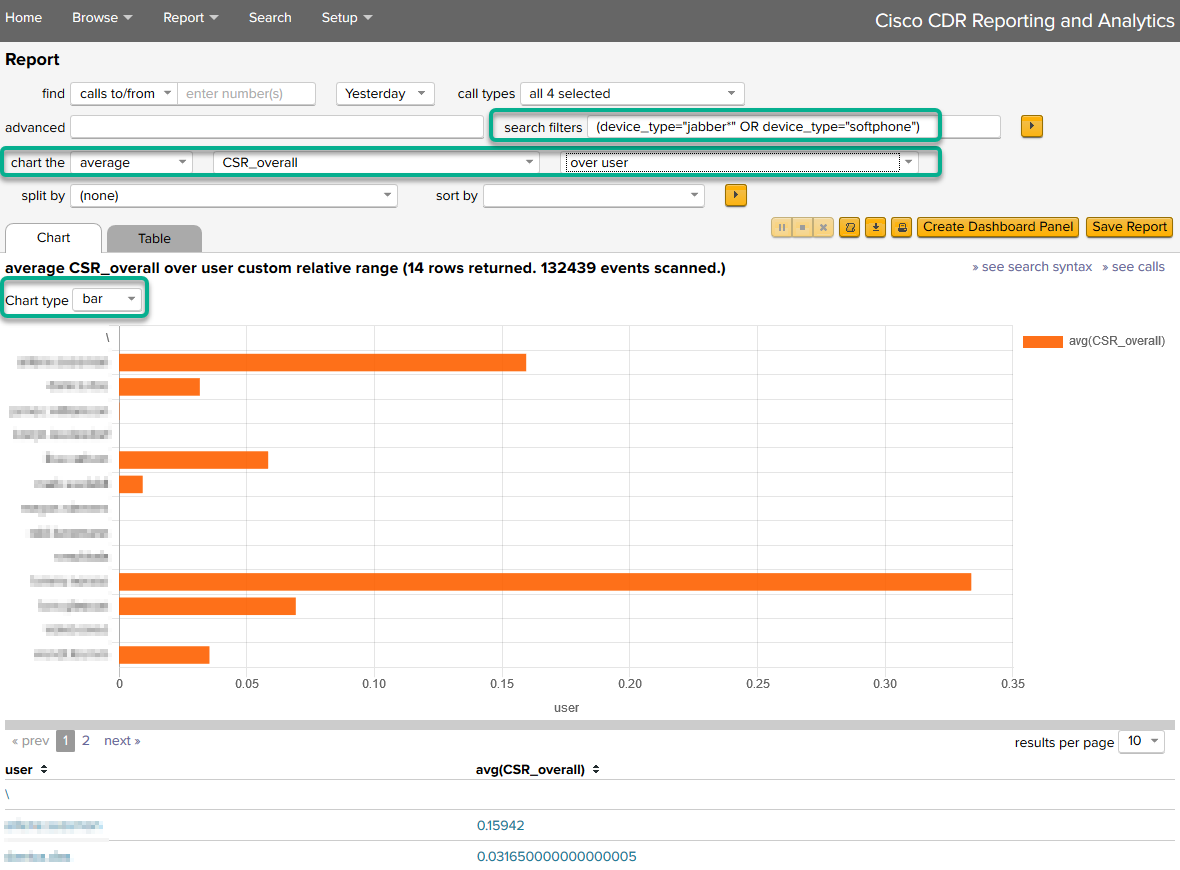
Also instead of charting the average, you could instead chart the max, or even 95th percentile depending on your needs and desires.
Or even do something fancy, like flip it back to over time, but now split by user, as I show below, so that you can try to find patterns in time.

Closing comments
All this is just the tip of the iceberg. Click around, try different things, see what they tell you. At any time you can drill down and zoom in and out on things, or even click the “»see calls” link near the upper right to hop back into Browse Calls and examine the calls you had it filtered down to to sanity check what you are seeing!
Related
Great software ultimately has to empower you to achieve more in less time. This extends to the company behind it -- we have to remember to always use your time as efficiently as we can.
And here I am happy to say that we shortened our Product Overview video dramatically. The new one is only 4 minutes long, vs 11 for the old one. You can see it here:
NOTE: the old one showed more of the product and was definitely more complete. In fact this was deliberate because we used it both for new users and also to be a deeper onboarding video for everyday users. However it was a bit too long for anyone who just wanted the short version and didnt want to spend 11 minutes of their day.
February 1st, 2024