Cisco CDR
Custom Maps – 1, Create a Tileset
March 4th, 2019
Imagine plotting your printer error count directly on a floorplan, or dropping count of failed backups on a campus map so you know which locations are having problems!
If you were to search for “Splunk custom map”, you might find as I have that the only customizations they talk about involve just putting *your* data on *existing* maps.
While this is useful, sometimes you need your own image used as a map. While looking, I found a couple of almost-solutions but nothing that solved the whole problem. It turns out that a large portion of this problem isn’t a “Splunk” problem, but will involve other products to build the maps themselves, so I decided to write this quick tutorial on how to build a map.
Having visited Washington D.C. a short time ago (for Splunk .conf 2018), I decided to try to make my own map out of an image I found on the internet of the national mall. I wanted this to consist of my own custom “map” that I could place in a dashboard in Splunk, and have data be populated into it just like any other map. The techniques here should apply to anything from a campus map to a floorplan.
The steps involved are (Current Step Highlighted below)
- Create a map out of your own image.
- This particular blog post is about this.
- If you already know how to do this, you can skip to the next section to put your map tiles into the right location in Splunk.
- Make that map show up inside Splunk and use it in a cluster map visualization
- If you already have map tiles and just need to make them visible and usable in Splunk, see the next blog.
- Turn your existing map into a Choropleth map and use it as a choropleth map visualization
- This can stand alone, too – if you want to use a built-in map and just need your own Choropleth shapes, you can start here.
Creating a “map” out of your image.
The term for this is to “create a tileset” of that image.
MapTiler.com has a downloadable free utility that can do this. The free version has these shortcomings:
- Watermarks “maptiler.com” all over the images,
- Offers no customizable zoom levels (you get what it decides you should get)
- (And several other restrictions which aren’t particularly bothersome or noticeable in our simple use case)
But even with those limitations, for a proof of concept it’s fine. According to their site, it’s only $29 to remove the watermark and allow customizable zoom levels. Note we’re not endorsing this product or anything like that, but I did find it seems to work OK for our limited example use case! I believe QGIS can also do all we would need, but it’s a far more capable and thus complex program. Still, if that is what floats your boat or if you have another favorite mapping program, by all means use that. Just know my instructions will be wrong. 🙂
- Download the INSTALLED version of MapTiler for your OS and install it.
- I guess you can use the web one, but it requires a login to be created and I didn’t do that, so I didn’t test it.
- Run MapTiler
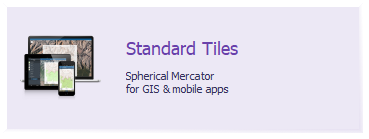
- Click Standard Tiles
- Drop your image onto the maptiler app where it tells you to.
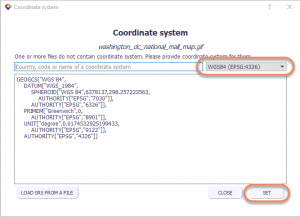
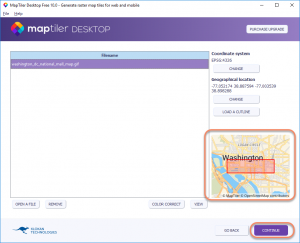
- Use WGS84 (EPSH:4326) as the coordinate system, click Set.
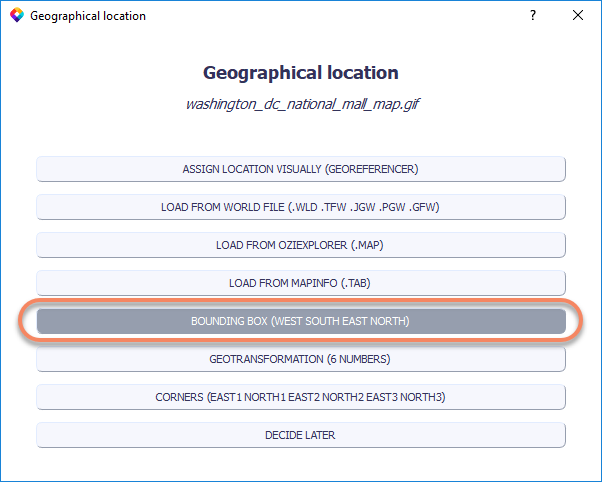
- Select your Geographical Location as “Bounding Box (West South East North)”
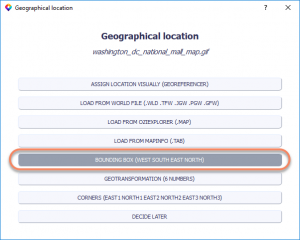
- Obviously, if you are some mapping expert you can use some other thing here. But if you are a mapping expert… please send me feedback on everything I did wrong here!
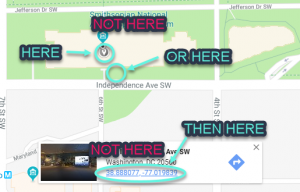
- Type in the various numbers. In our case, we’ll look them up with Google Maps comparing with our image.
- Looks like the upper left of my image is at 38.898288, ‑77.052174
- Lower right is 38.887594, ‑77.003539
- The resulting ‘West South East North’ would be ‘-77.052174 38.887594 ‑77.003539 38.898288’
- BIG TIP – If you click on something that’s not anything in Google Maps (e.g. “click somewhere other than on a label”), it’ll pop up a little box at the bottom with the latitude and longitude, but they’re not able to be copied and pasted from there. Instead, click on the latitude/longitude (not on the rest of the popup, but *exactly on the numbers* themselves and you’ll open up to somewhere where you can copy paste it from). Finicky, but it works fine once you get the hang of it.
- Confirm your little preview looks OK, and click Continue when it does.
- If the preview only shows blue, that means your numbers are off and you are mapping in the ocean. I did this a time or two before figuring that out. Did I mention I am only an enthusiastic amateur, not an expert?
- You can click it to open it in a real map where you can zoom out to see which ocean you ended up in. I usually end up being stuck in the Pacific off the coast of South America.
- Notice that the Zoom levels seems to adjust itself based on the span of your image’s latitude and longitude.
- NOTE the zoom levels (the arrows point to them in the above screenshot)! You’ll need them later!
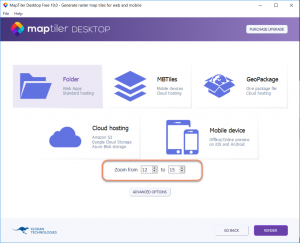
- For my map, they were 12 – 15.
- Again, you can’t change these in the free version you are just stuck with what they decide is right.
- Click the “Folder” option

- In the dialog, browse to a temporary location and make a NEW empty folder and click “Select Folder”
- MapTiler will automatically render your image, so be patient if it takes it a moment.
- The free version is also limited to using only one CPU for rendering.


When it’s finished, your source folder will have some files and some folder in it. The folders actually correspond to the zoom level, so that “12−15” we saw before will be obvious here too.
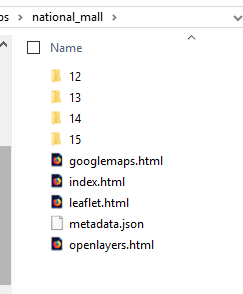
If you dig down into it, you’ll find the leaves of those folders will be PNG files.
Next Steps
Now that you have map tiles created out of your image, you’ll want to move on to the next post on Using Your Map Inside Splunk which makes it so you can use them as a map inside Splunk.
Related
Great software ultimately has to empower you to achieve more in less time. This extends to the company behind it -- we have to remember to always use your time as efficiently as we can.
And here I am happy to say that we shortened our Product Overview video dramatically. The new one is only 4 minutes long, vs 11 for the old one. You can see it here:
NOTE: the old one showed more of the product and was definitely more complete. In fact this was deliberate because we used it both for new users and also to be a deeper onboarding video for everyday users. However it was a bit too long for anyone who just wanted the short version and didnt want to spend 11 minutes of their day.
February 1st, 2024