Cisco CDR
Work From Home, Part 4 – Gateways That Are Less Utilized Now
March 26th, 2020
With the current emphasis on working from home and all the changes that incurs, maybe one of these questions is now suddenly more important to you than it used to be!
Today’s topic
- What gateways do I have that are now far *under* capacity?
Other pages this week:
- Is mobility working right, are people receiving phone calls
- How many folks are using Jabber or softphones?
- What gateways do I have that are reaching capacity?
- How can I see the names for mobile calls from our employees?
Checking on your gateways
There are a couple of ways to accomplish this.
One simple way might be to just compare the Call concurrency and gateway utilization for the two time periods.
Build the search for the first time period
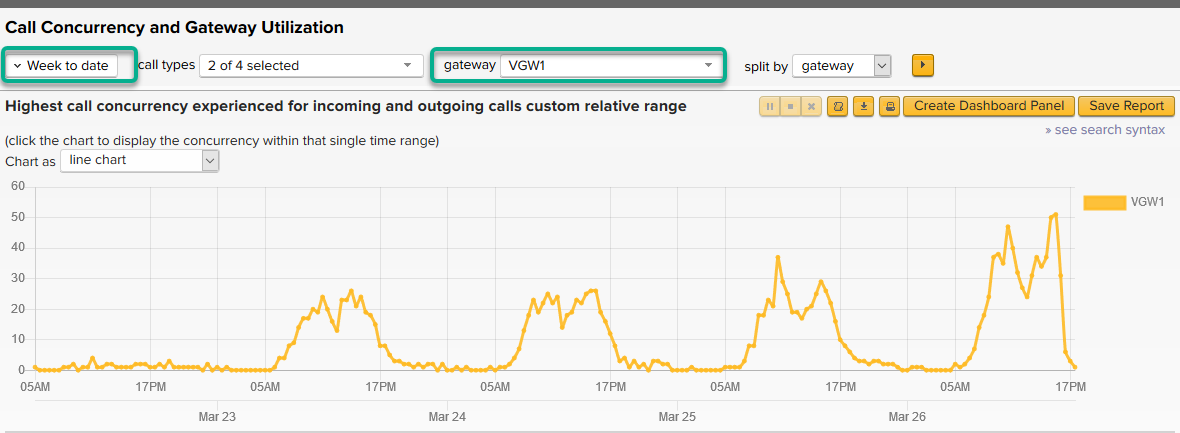
For the first, click Report then Call concurrency and gateway utilization. Change the time range to something appropriate, like Other->Previous Week (or since today is Thursday, I’m going to select “Week to date” because that’s close enough), and select the gateway you want to examine.
Now open a new page for the new time period
Now, using whatever method you prefer to open a new tab and navigate to this same page. (I recommend in this case to right-click on the browser’s tab, select “Duplicate tab” or whatever your browser’s option for that is).
On the new tab, change the time frame to a corresponding typical week before all this stuff started happening. Like, the first week of February or something. Get those side by side and compare!
Eyeballs and the human brain are pretty amazing at finding these sorts of differences. Do be careful of the scale on each.
Super fun but advanced way
All right, time to play!
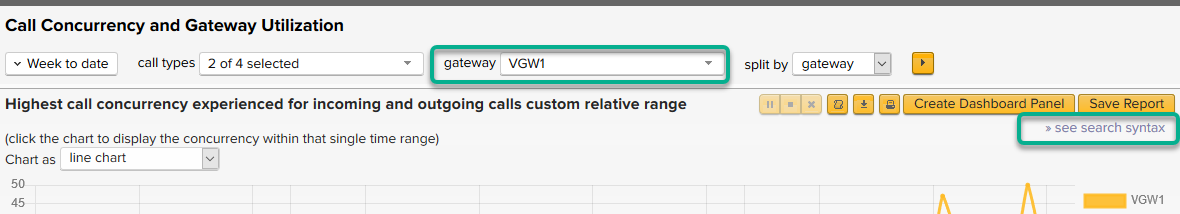
As above, start from Report then Call concurrency and gateway utilization. Change the options to select the one gateway we’d like to look at, leaving everything else where it is.
Now, click the “» see search syntax” link.
Don’t be scared! We’ve totally hidden all the scariness behind macros, so lucky you!
(You can show the actual macros involved by, while having your cursor in the SPL/text editing box, pressing Ctrl‑e (or splat‑e on a mac, I think?). Anyone who can make an attempt at explaining “how this works” gets a free t‑shirt! And Nick doesn’t even know that I’ve thrown down this gauntlet, but I’m sure he won’t mind. Email it to me at docs@sideviewapps.com which is just an alias that points at me anyway.)
All right, what in the world do we do here? I’ll number the three little things to change:

- Change the timeframe from whatever it is currently, to something long enough that you’d want to show the difference over. Like, “last 4 weeks” or maybe “Month to date” if it’s nearly the end of the month.
- In the empty line between the timechart_for_concurrency macro and the fields command, add
| timewrap 1week - Finally, put a * after your gateway in the fields command, like in my case change
| fields _time _span VGW1
to| fields _time _span VGW1*
Here’s after I’ve changed it and run the search. IGNORE MY BUSTED TEST DATA, I only have a week so I have to make it repeat to do longer than a week periods, so the data just lays on top of itself.
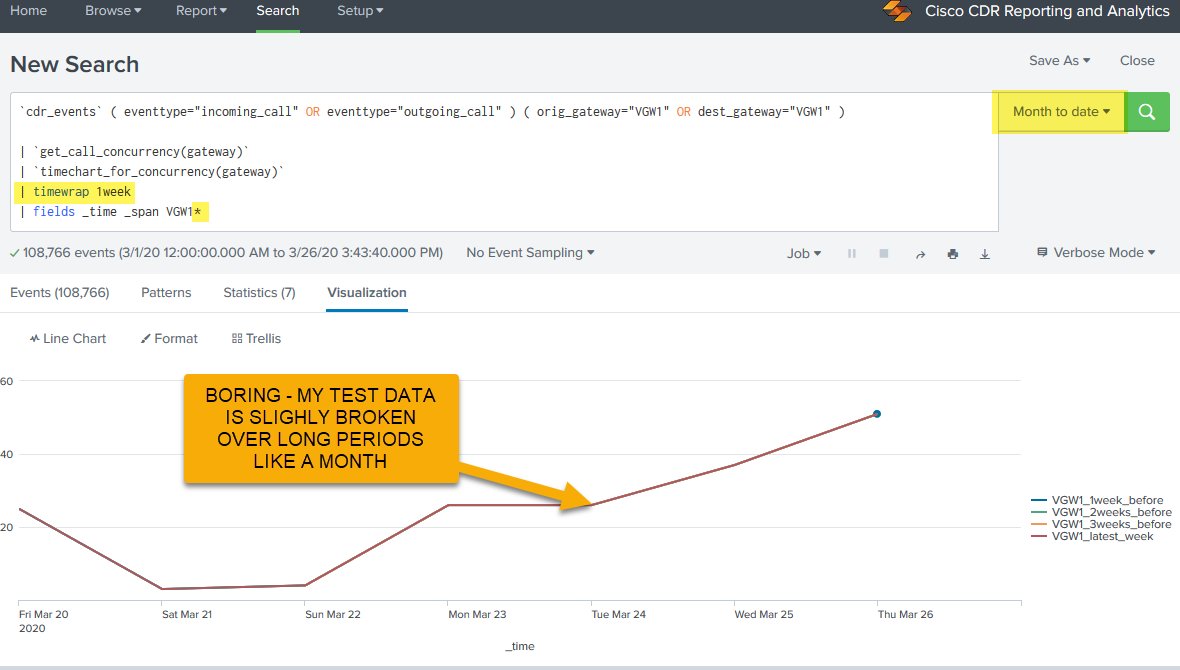
What this will did was 1) make sure we have enough data to compare with. 2) split the resulting timechart into 1 week chunks with the labels being things like <mygateway>_2weeks_before, and 3) tell the fields command to include any fields starting with your gateway name.
Doing the same thing only with an example to show you it really does work
Just to make sure you can see what this will look like, I’m going to do this same process over a week (Previous week) and timewrap it day by day. Here I just point out where I made those changes, just so you don’t forget.
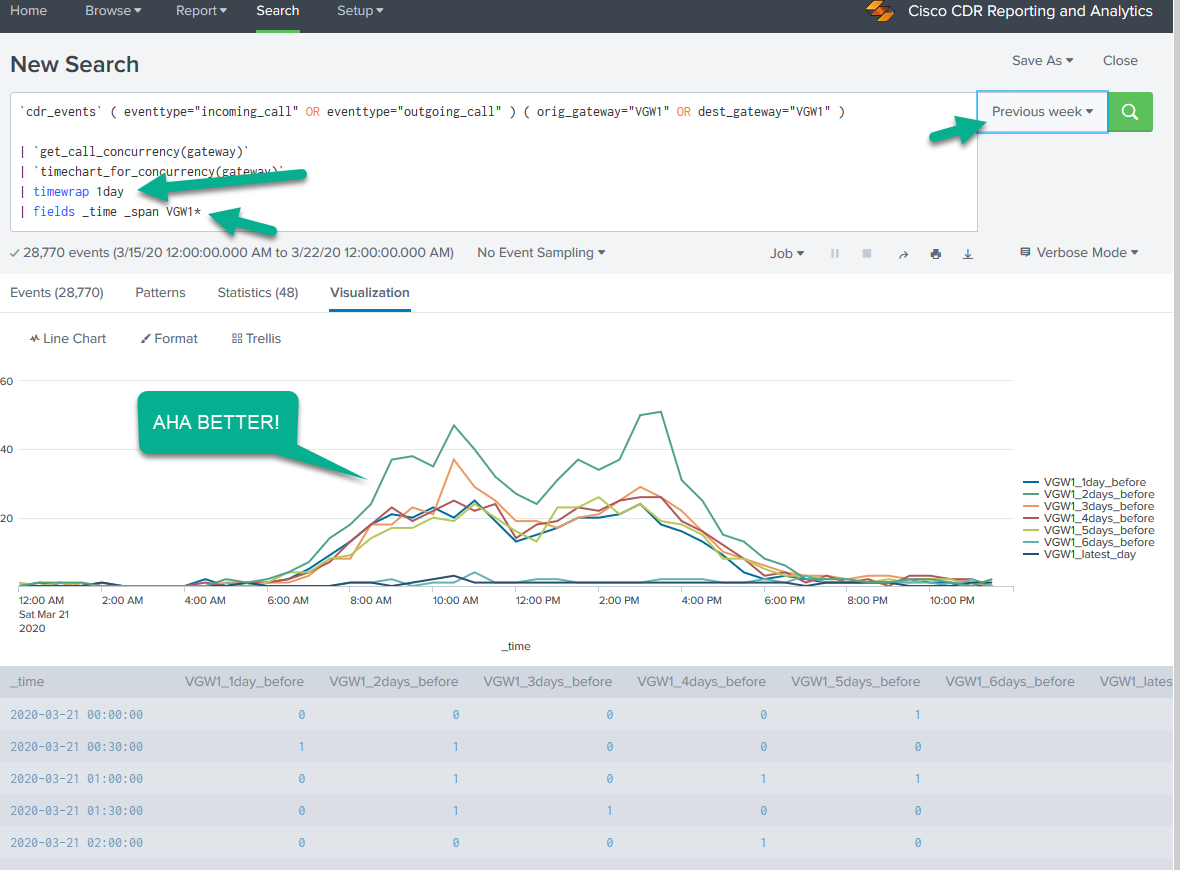
Now we can plainly see that “things happen”.
A few explanations: In the time period “previous week”
- The last day of that time period (Saturday) will be the “VGW1_latest_day”.
- The day before that (Friday) is VGW1_1day_before
- The day before that (Thursday) is VGW1_2days_before
- and so on.
There are options to changing the labels to some extent, and you can read about other time periods instead of just 1day and 1week in a link down in the References section. I will only warn you that … be patient. This can be a slow report. 🙂
References
Timewrap: a great utility that used to be a separate app, but is now wedged right into Splunk! Read more in the official Splunk timewrap command documentation.
A place to find more information is to search for fields in our field gallery!
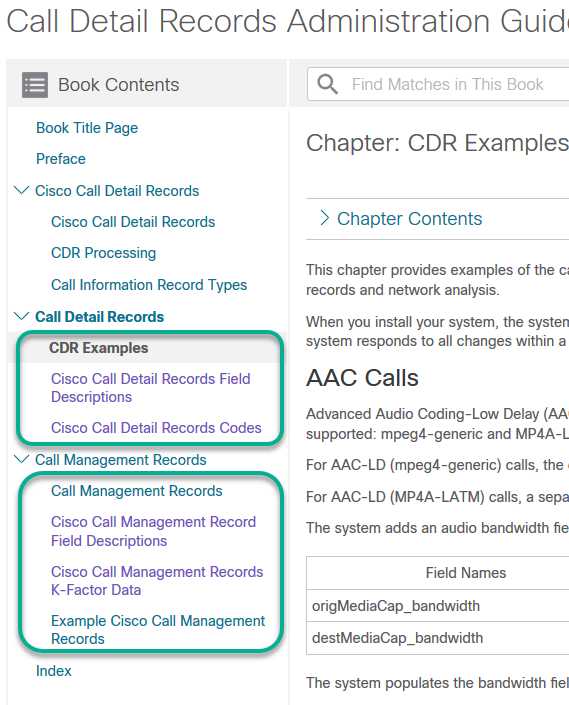
Another great place is the following link for the Cisco documentation for CDR data.
Be sure to click on each of the menu items on the left – they each have information in them that’s useful!
Related
Great software ultimately has to empower you to achieve more in less time. This extends to the company behind it -- we have to remember to always use your time as efficiently as we can.
And here I am happy to say that we shortened our Product Overview video dramatically. The new one is only 4 minutes long, vs 11 for the old one. You can see it here:
NOTE: the old one showed more of the product and was definitely more complete. In fact this was deliberate because we used it both for new users and also to be a deeper onboarding video for everyday users. However it was a bit too long for anyone who just wanted the short version and didnt want to spend 11 minutes of their day.
February 1st, 2024