Cisco CDR Reporting & Analytics | Docs
Using Groups and Extensions Fields
If you or your admins have followed our steps to set up the Groups Lookup, then various new fields will be available in many places across the app that represent names of individuals and what groups and subgroups they work in, within your organization.
Specifically when the extensions or DN’s of any party in any call match the numbers in this lookup, new fields will be created as appropriate: callingPartyName, callingPartyGroup and callingPartySubgroup. Then on the called party side there will also be finalCalledPartyName, finalCalledPartyGroup and finalCalledPartySubgroup.
These fields can all be used as easily as if they were fields in the raw CDR, for filtering searches, and as primary and secondary fields in your reports. Furthermore you can mix and match these fields in individual reports and searches with not only other CDR and CMR fields but also with all the other non-CDR fields added on the fly, for instance with Location fields or with Device fields that ultimately come from CUCM itself .
Also note that for high level examples of the sorts of things you can do with these fields, you might check out our overview page for Agents, Users and Huntgroups
Using Groups and Extensions fields in Investigate Calls
To add them to your results right away in Investigate Calls — simply review our general Usage docs for changing your selected fields. You will find the location fields described above listed in Edit Fields, and you can select them like any other. Once a location field is selected and displayed in your search results, review our Usage docs for how you can add them as search filters just by clicking on them.Using these fields in the Chart page
If you have not already, review our Usage docs for creating charts.
For a specific example try setting type to just incoming, then changing over time to over finalCalledPartyGroup. This will give you a report on how many calls are answered by each group or department in your organization.
Follow other sections in our Usage docs to flip back to Investigate Calls, peek at some other fields, then add some more searchterms, and flip back to Chart, and you’ll be able to iteratively build charts that give very specific insights.
Switching back and forth between Investigate and Chart
Remember from our Usage docs that from any chart you can always drill down on elements to see the actual calls, and conversely from any set of search results you might have in Investigate Calls, you can always create a chart from that investigation, and set the over field to quickly spot-check the breakdown of these calls by callingPartyGroup, finalCalledPartyName, or group, etc
Using the Investigate Groups page
Navigate to Investigate > Groups. If you or your colleagues have set up the groups lookup you will see overall call stats for each of your defined groups. Note you can use the pulldowns to narrow the scope of this report to only particular groups and subgroups.
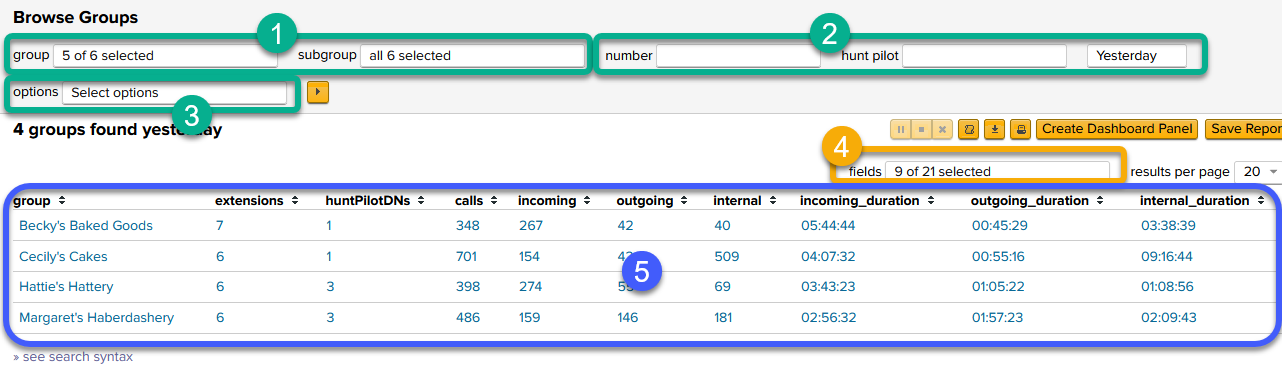
- Try filtering by group and by subgroup
- These are “AND”ed together. So if you pick the group of Cecily’s Cakes and a subgroup of The Shire, for each group you will only get call stats for extensions that had membership in both of those.
- Try other filters
- number
- hunt pilot
- And a time range picker
- number
- Two very useful options:
- a) include or don’t include groups that made no calls in the timeframe.
- b) count or don’t count calls with zero duration in the totals
- Add or remove fields from the table. Note there are many optional fields not displayed by default.
- Data!
Click on any row for drilldown options. You can view the given group’s extensions in Investigate Extensions or examine all the calls to/from that group in Investigate Calls

Using the Investigate Extensions page
Navigate to Investigate > Extensions. A list of all your internal extensions will be displayed with call statistics. If you or your colleagues have set up the groups lookup, then you will also see the name and group fields populated for some or all extensions, and the group and subgroup pulldowns will also be populated.
Note users can also get to this page by clicking on an individual group row from within Investigate > Groups.
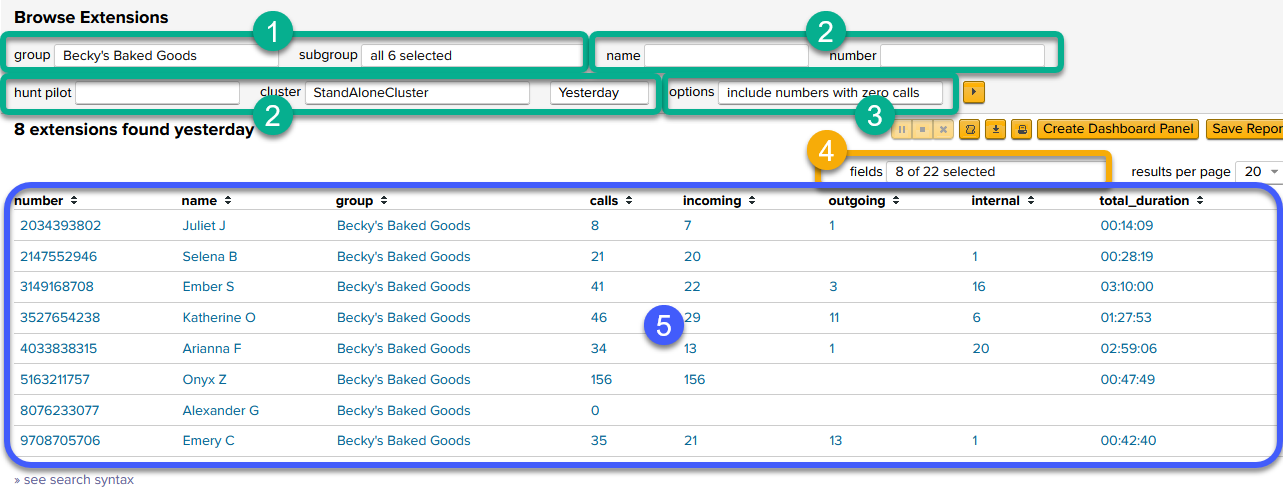
Note the numbers in the image above correspond to the descriptions below
- Try filtering by group and by subgroup
- These are “AND”ed together. So if you pick the group of Cecily’s Cakes and a subgroup of The Shire, you will only get those extensions that had membership in both of those.
- try other filters
- name
- number
- hunt pilot
- cluster (for those whose environments are larger!)
- And a time range picker.
- name
- Two very useful options to note:
- a) include or don’t include groups that made no calls in the timeframe.
NOTE – “Alexander G” on the second to last line in the screenshot above shows 0 calls, but is included because we’ve set the option to “include” extensions with zero calls. If we had instead this set the other way, he would not show up. - b) count or don’t count calls with zero duration in the totals.
- a) include or don’t include groups that made no calls in the timeframe.
- Add or remove fields from the table. Note there are many others that are not selected by default.
Click on any row to go to Extension Detail.
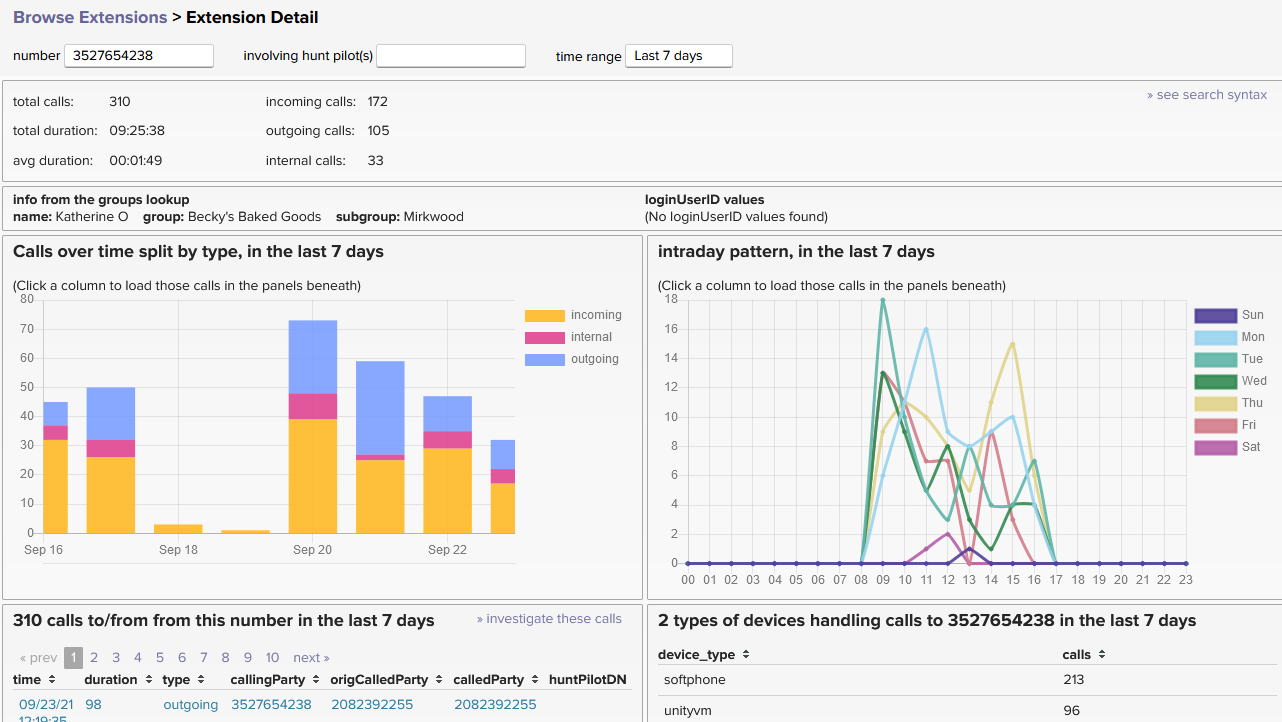
Extension Detail
This page tries to give a broad overview of activity around this extension. However note there are also several drilldowns that lead deeper, and you can click “investigate these calls” to switch gears entirely.
Further exploration
To find potentially interesting charts with just a couple of clicks, return to the app in Splunk, click Home to return to the landing page and within Explore new reports on the lower left, click Agents/Users/Huntgroups
Also to get more ideas about what sorts of things you can put together, visit our overview page on this website for Agents, Users & Huntgroups
If you have any comments at all about the documentation, please send it in to docs@sideviewapps.com.