Cisco CDR
Custom Maps – 2, Using Your Map Inside Splunk
March 15th, 2019
Imagine plotting your printer error count directly on a floorplan, or dropping count of failed backups on a campus map so you know which locations are having problems!
If you were to search for “Splunk custom map”, you might find as I have that the only customizations they talk about involve just putting *your* data on *existing* maps.
While this is useful, sometimes you need your own image used as a map. While looking, I found a couple of almost-solutions but nothing that solved the whole problem. It turns out that a large portion of this problem isn’t a “Splunk” problem, but will involve other products to build the maps themselves, so I decided to write this quick tutorial on how to build a map.
Having visited Washington D.C. a short time ago (for Splunk .conf 2018), I decided to try to make my own map out of an image I found on the internet of the national mall. I wanted this to consist of my own custom “map” that I could place in a dashboard in Splunk, and have data be populated into it just like any other map. The techniques here should apply to anything from a campus map to a floorplan.
The steps involved are (Current Step Highlighted below)
- Create a map out of your own image.
- If you can’t yet see your map “inside Splunk”, then hop back to the previous blog and convert your image into a usable map.
- Make that map show up inside Splunk and use it in a cluster map visualization
- This particular blog post is about this.
- If you already have map tiles and just need to make them visible and usable in Splunk, you are in the right place!
- Turn your existing map into a Choropleth map and use it as a choropleth map visualization
- This can stand alone, too – if you want to use a built-in map and just need your own Choropleth shapes, you can start here.
Make your map “show up” in Splunk
Now, to make these appear in Splunk, we’re going to use a mostly undocumented capability to let Splunk host the maptiles. This has worked for several years, and I see no reason why it wouldn’t continue to work so it ought to be safe – but be warned that I’m not sure it’s fully supported or that it’ll continue to work forever, so use at your own risk. 🙂
NOTE these instructions assume you have an app call appname that you want to use this map from. Substitute in your own appname, and if you haven’t put this into its own app, perhaps you should create a new empty app and use that just to keep this all contained.
- Copy (or SFTP) the maptiles folder structure into the following location on your server.
$SPLUNKHOME/etc/apps/appname/appserver/static/- You may have to make the folder “appserver” and “static”.
- If you do, if you are on Windows you’ll have to make sure it has the right permissions!
- The permissions are super-important. New folders will likely be made with your own USER having permission to it and no one else.
- That really needs fixed. I can’t stress this enough.
- The result in my case is
/opt/splunk/etc/apps/appname/appserver/static/national_mall - Obviously, subfolders and files are under there too like:
/etc/apps/appname/appserver/static/national_mall/13/2342/3133.png
- You may have to make the folder “appserver” and “static”.
- Restart Splunk
- Make a new search, here’s a quick way to mock up 2 data points to use for testing.
| makeresults
| eval lat="38.896123,38.890987"
| makemv delim="," lat | mvexpand lat
| eval lon = if(lat="38.896123", -77.042174, -77.013539)
| geostats count
- Obviously, you’ll have to change your latitudes and longitudes into ones inside your own map!
- Change to the Visualizations tab
- Change the visualization to Cluster Map
- It should be in the “Recommended” section, but if not just find it in the whole list.
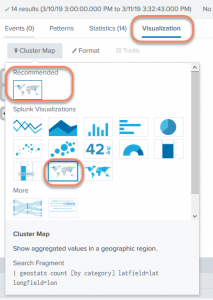
- It should be in the “Recommended” section, but if not just find it in the whole list.
- And tada! It sort of kind of … Oh, it’s not working yet and it’s on the wrong map and I can’t zoom in far enough and …
- Don’t worry that it’s all goofed up! We’ll fix it soon.

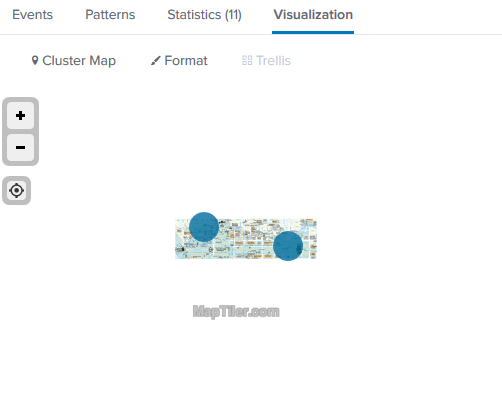
Let’s take stock of where we are right now. This is what I see:
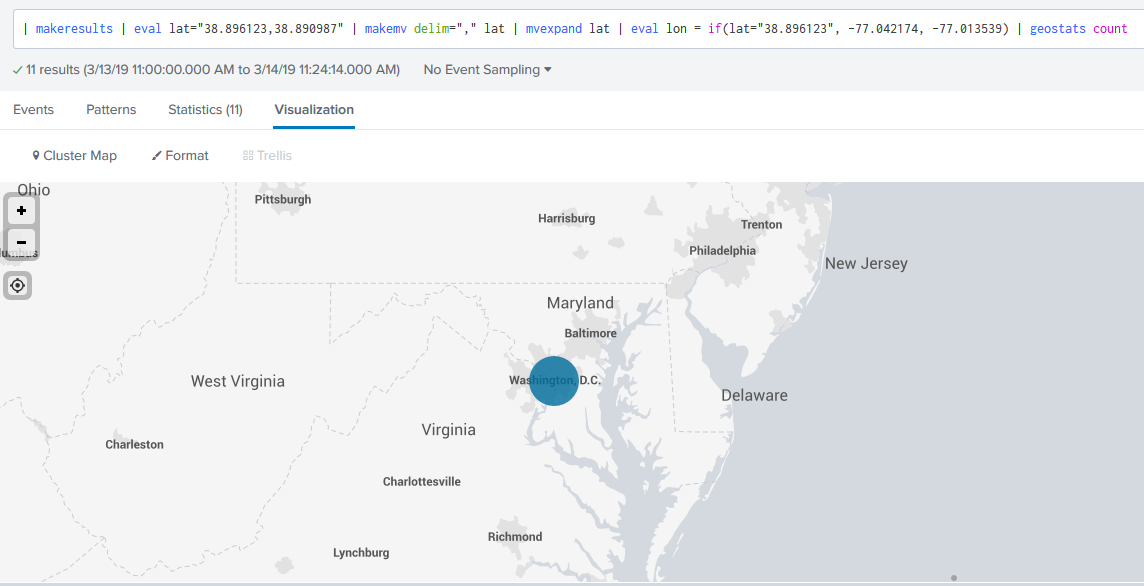
Which shows me only that my latitude and longitude on my test SPL is about right. The National Mall in Washington D.C. is indeed pretty much under that dot, so that’s good and we’ve made progress!
No seriously, I really was wanting to use my own map?
Don’t worry, we’re almost there. First, a very short diversion …
At this time you are using Splunk’s built-in maps. These have a zoom limit of 7 which is perhaps “state” or “small country” sized (as you can see above), and we need to turn the “zoomability” way up even past 11. I’d suggest changing that to openstreetmap.org’s tiles temporarily because they support zoom levels that let you get in real close and confirm that your lat/long for your sample data is right.
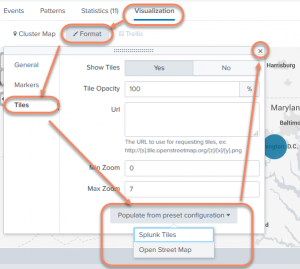
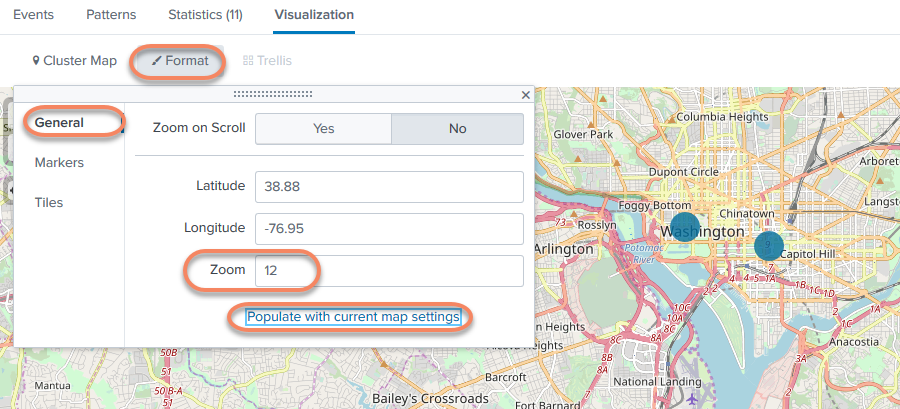
- Click the Format button on the visualization.
- Select subsection Tiles
- At the bottom, click the Populate from preset configuration
- Select Open Street Map
- Click the “X” on the format menu to save it. I really wish there was a positive way to say “Save this” but there isn’t. I guess it’s the new way.
- Zoom in/around until you can see your own dots, zoomed in to where it makes sense.
- Let’s “save these settings” by clicking Format and then Populate with current map settings.
- You’ll see Latitude, Longitude and Zoom all change.
- CONFIRM that the zoom level is between your map’s max/min zoom!
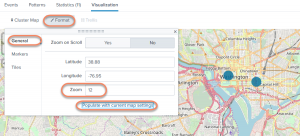
- Do the click-the‑x trick to close it again.

Goodness, Rich, did you not hear that I wanted to use my OWN tiles?
The preceding was for your own benefit. Because now that you have the zoom level right, when you switch to your own map you’ll actually see your own map instead of a sea of white with dots in it!
So, without further ado, let’s change to your OWN tiles!
- Click the Format button on the visualization.
- Select subsection Tiles
- In the URL put in /static/app/appname/<mymaptilefoldername>/{z}/{x}/{y}.png
- In my test case, /static/app/appname/national_mall/{z}/{x}/{y}.png
- Change Max Zoom and Min Zoom to your Min/Max zoom levels that we noted before (12 and 15 for this particular example)
- And again, Click the “X” on the format menu. “Trust us, that saves the settings”.
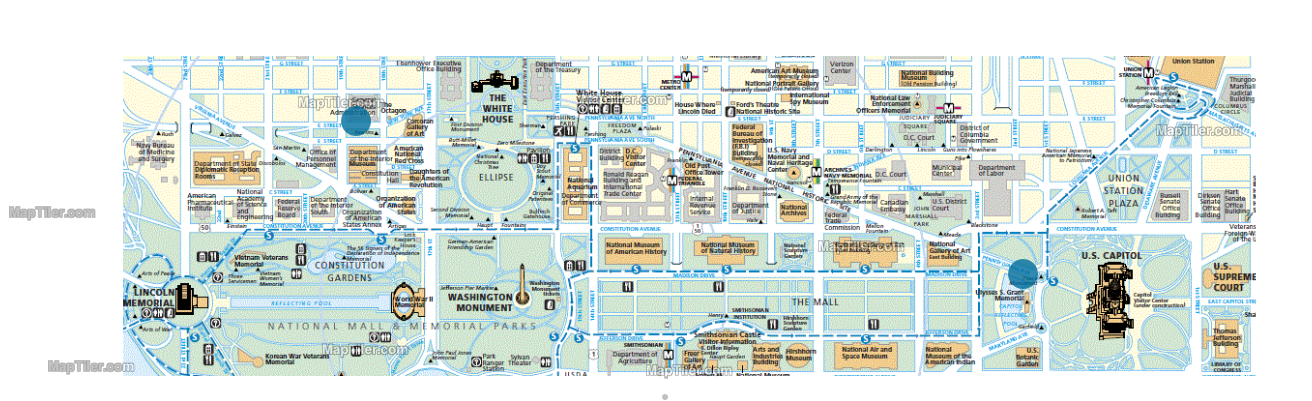
- And TADA! You should now be presented with your own map, with dots on it!
- Note, sometimes if you enter things in the wrong order, the map may move and recenter you elsewhere. Just zoom out until you see your dots, then zoom back in to the right place.
And it’s even zoomable (within the bounds of your allowed zoom levels).
Some Notes
I have had good luck when the source map/image is very colorful or busy, of adjusting its opacity. Format, Tiles, then adjust Opacity downwards to, oh, I find values between 25 and 50 work pretty well. Obviously, if you are using black and white simple maps, this probably isn’t necessary.
Using your map with your data
Now that you have a map displaying, how actually would you use it?
Any data that has a latitude and longitude within our bounds would be able to be used. And this could be done with a lookup.
So let’s try a quick one. It will be simple and only have a few items, but hopefully you’ll get the idea.
Create the lookup
What we need is a way to have a place name pull up a latitude and longitude that is on our map. I’m going to use names like ‘Smithsonian National Air and Space Museum’ and ‘The White House’, so let’s build one a lookup with those two entries.
I’m not going to clutter this up with a lot of screenshots – There a lot of good documentation on how to do this process in Splunk’s Knowledge Manager Manual, so you can refer there if you get stuck. You can also read more about the lookup command in the lookup section of Splunk’s most excellent documentation.
- Create a csv file with data like, in our case
location,latitude,longitude
"Smithsonian Air and Space Museum",38.888000,-77.019800
"The White House", 38.897449,-77.036538
- Save that as a csv in $SPLUNKHOME/etc/apps/appname/lookups, let’s call it “mall_addresses.csv”
- Click Settings, Lookups.
- Click Lookup table files and confirm that file you just made is listed, and that it’s Sharing is set to Global.
- Go back to Lookups, and click Lookup Definitions
- Click New Lookup Definition
- Make sure your app is listed as the Destination app
- Type in a name – it can be the same as the lookup’s filename or different.
- We’ll use mall_locations because that’s what I really should have called the csv file too.
- Just a happy little accident, but it’s OK.
- Change the Lookup file drop-down to point to our mall_addresses.csv
- And in many or most cases, click Advanced and in there turn off Case sensitive match
- Click Save
Use the lookup for your own data
In your case, I’m sure you have a location field that matches the “location” in the lookup. I don’t, so I’m going to cheat and use a faked-up event with makeresults, like we did way up above to test with. In your case, use a search that returns those locations.
Without doing anything else, when I run the search below I end up with a single event timestamped now, with “myLocation” as the “Smithsonian Air and Space Museum”. Your data, obviously, will have a lot more stuff in it, but if it had values for a field somewhere in it called “myLocation” that looked like the one I have below, it would be usable just like I’m using these results.
| makeresults | eval myLocation="Smithsonian Air and Space Museum"
But unfortunately, it has no latitude and longitude so we can’t plot it on the map. Yet.
So, add our lookup to the end of that search to have it look in that lookup table and tell us the lat/long of what we need.
| makeresults | eval myLocation="Smithsonian Air and Space Museum"
| lookup mall_locations location AS myLocation
Again, you can consult the docs on the not-always-obvious syntax, but that’s ” | <command> <lookup name> <key field in the lookup> AS <field that exists in my data that matches>”
Now our results have latitude, longitude and myLocation. So let’s plot them!
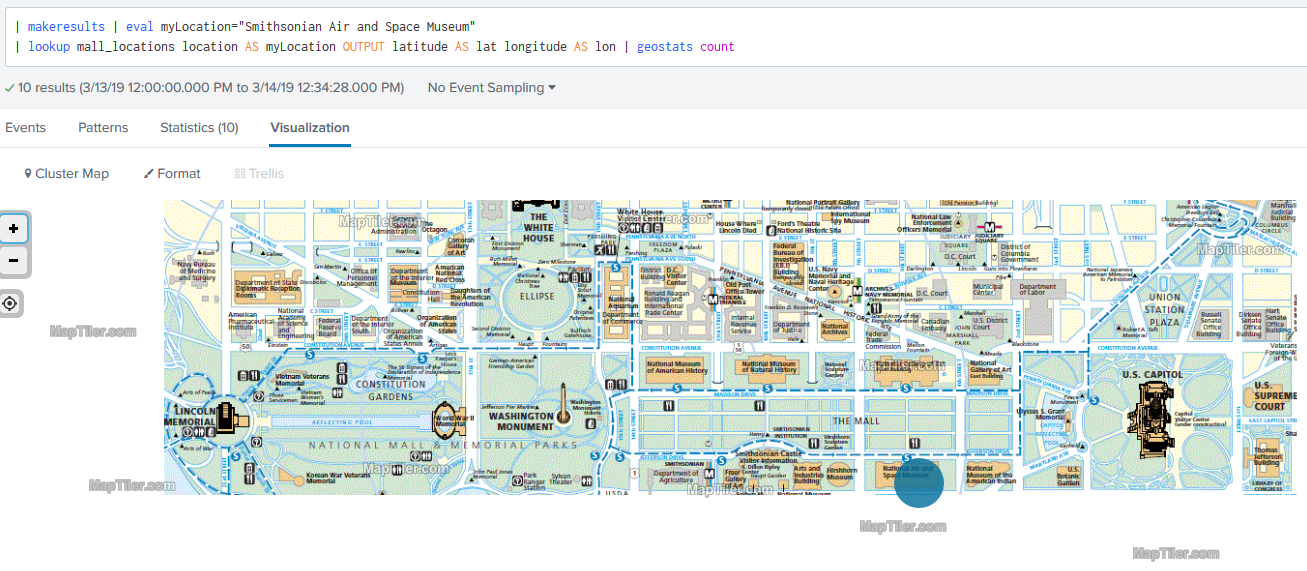
| makeresults | eval myLocation="Smithsonian Air and Space Museum"
| lookup mall_locations location AS myLocation | geostats count latfield=latitude longfield=longitude
You’ll notice something – I had to tell the geostats command what my latitude and longitude fields were called. This is a common thing, geostats expects fields named lat and lon and so you have to tell it what fields match those in your data. Also note there’s all sorts of stats commands you can use in the geostats. Count, sum, avg, … check the docs link before and it’ll have a list.
An alternative would be to either create the lookup with those as field names (“lat” and “lon”) instead of latitude and longitude.
Another alternative is to make the lookup rename them when it does it output –
| makeresults | eval myLocation="Smithsonian Air and Space Museum"
| lookup mall_locations location AS myLocation OUTPUT latitude AS lat longitude AS lon | geostats count
Those are all functionally equivalent.
Next Steps
Now, there’s another exciting way to use this map. Coming soon, I’ll have instructions on converting it into a Chloropleth map.
Related
Great software ultimately has to empower you to achieve more in less time. This extends to the company behind it -- we have to remember to always use your time as efficiently as we can.
And here I am happy to say that we shortened our Product Overview video dramatically. The new one is only 4 minutes long, vs 11 for the old one. You can see it here:
NOTE: the old one showed more of the product and was definitely more complete. In fact this was deliberate because we used it both for new users and also to be a deeper onboarding video for everyday users. However it was a bit too long for anyone who just wanted the short version and didnt want to spend 11 minutes of their day.
February 1st, 2024