Cisco CDR
Performance Notes
October 5th, 2018
Performance is a very big topic. We try here to break down a few app-specific items on the browse calls page to help make sure your searches don’t take any longer than necessary. The tools we show you how to use should let you perform your own analysis on other screens in the Cisco CDR Reporting and Analytics app.
Prologue – how do I *see* performance information?
On the right, over by the app’s Save button, is a link to the Job Inspector.

When you click that, a new page opens with a whole world of interesting and arcane stuff, but for the most part we only care about one tiny little piece – the top line of returned information.
This search has completed and has returned 19,273 results by scanning 45,510 events in 40.235 seconds
Most of that is pretty self-explanatory. The search returned a little less than 20,000 results in about 40 seconds. The middle piece – “by scanning 45,510 events” – tells you how many events it read off disk to do what it did. This is probably the most important piece of information there – every disk read costs time because it’s the slowest operation in most Splunk installations. Generally, minimizing the number of disk reads will increase performance the most.
The second most important piece is how many results we have to handle. So in this case, 45,510 events were read off disk, but only 19,273 ended up having to be displayed. This has a smaller effect than the number read off disk, but is probably our second most important result.
Those results were a result of a search that was basically “wide open” on the last 7 days – note specifically that the get only dropdown was set to get only all records so that it retrieved *everything* in that time frame. We’ll use this as our baseline search and see which fields below can improve that time.
For more information on the Job Inspector and how to read all the other information that it contains, see the Splunk documentation on Viewing search job properties.
1) Browse Calls, and general app performance
As with many of the pages in the Cisco CDR app, the fields can be divided into three broad categories. Those that the use of should improve performance, and ones that have no effect on performance, and ones that may or may not affect performance.
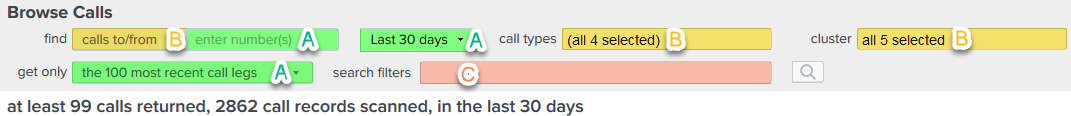
I’ve outlined the above three categories with colors and letters, so let’s start with the ones that make the biggest difference in performance.
Category A (Green):
Using these three fields will generally see the largest speed improvement.
get only “the X most recent call legs”
This is a very “blunt object” optimization. Many of the other fields are like a scalpel – sharp and precise. This is more like using a sledgehammer to knock off the pieces that don’t fit. It literally just “stops” retrieving records at X amount, then does its work on what did get returned. The idea is that if you are in here browsing around calls, the recent results are all that you are going to manually look at, so only snagging the first 100 or 1000 legs is often plenty for your needs, but reduces the load on the system significantly over retrieving all the call records.
How significantly?
Remember my baseline – showing get only all records over the past 7 days:
returned 19,273 results by scanning 45,510 events in 40.235 seconds
With it set to get only 1000 most recent call legs, the search:
returned 425 results by scanning 1,702 events in 9.843 seconds
That’s more than a 4x improvement in speed!
Remember what I said about retrieving events from disk and displaying them being the slowest actions, and that how many were actually returned being the second? You can see that the number of events read went from 45,510 to 1,702, the returned results went from 19,723 to 425, and that the overall time went from 40 seconds to under 10 seconds.
There are some minor things to note about using this field, though. With the drop-down set to a size smaller than the expected number of results, there are two main drawbacks. First, some older records won’t be returned. This is probably fine if you are just poking around at recent calls, but could be an issue if you are looking for a sparse number’s calls – if you are searching for extension 567 and that extension only makes one call per week in your 10,000 call/week system, well, setting that too low will obviously trim out most of the results so your information will not be accurate in aggregate. Similarly, the totals line (425 calls returned…) may not be accurate because it can’t count the records it didn’t retrieve.
These limits are all removed if you flip over to the “graph calls over time” General Report tab. Or just start your searching with get only … set to something small for speedy results, then when your results seem to match what you want, change it to show all call legs to get a better, more definitive overall answer. If you even need that. Again, the definitive answers are probably best from the General Report tab.
Enter Number(s) (formerly the number/ext field).
Unlike the sledgehammer of how many recent call legs to retrieve, this is a surgical instrument, slicing into the data in a very precise way. This is probably the finest-grained performance improvement you can make to a search and whenever appropriate you should include it. How much faster does this make the search?
Remember my baseline – showing get only all records over the past 7 days:
returned 19,273 results by scanning 45,510 events in 40.235 seconds
With it set exactly the same only except with adding a number to filter on:
returned 42 results by scanning 84 events in 5.408 seconds
10x speed improvement! This varies – a number that’s in a *large* portion of your events, say 30%, may only give you a 5X speed improvement.
As with the previous field, there IS a small caveat to using this, but it’s one that’s unlikely to cause problems. This field triggers the use of a subsearch inside Splunk, and Splunk has limits on subsearches to keep them from gobbling up all the RAM. Because of that, somewhere around or above 10,000 returned results might trigger it to truncate results. Of course, it’ll be the oldest records that get truncated and we don’t expect anyone to page through the 500 pages (at 20 per page) of results to get to where the truncation happened, but it’s good to know that its behavior is goofy if you try to go out that far.
The timeframe
I’m not going to belabor this point – reducing the time frame reduces the amount of searching Splunk has to do and the overall number of results it has to retrieve, and thus reduces the search time correspondingly. Hopefully that is obvious now that I say it.
Category B (Yellow), The “it depends” fields
There are times when these fields reduce run-time fairly significantly, but other times they do not. There are a lot of reasons for why this is, and they’re too lengthy to go into even with my propensity for voluminous meanderings in blogs. An example may illustrate one common reason why this field may or may not improve performance:
The Clusters lookup – for the many people who have a single cluster, this setting won’t make any difference. But suppose you have 10 clusters and the searches you are doing should be contained within “Cluster07”. In that case, if the CDR data comes approximately equally from all 10 clusters, then changing the clusters dropdown to only show data from “Cluster07” you should get up to about a 10x speed improvement because the search only has to look at 10% of the data. Sensible, isn’t it?
The other fields in this category are like that. If it reduces the number of events having to be read off disk, it’ll improve performance. If it won’t reduce them – generally because the search is already specific enough – then there will be no overall performance improvement by using it.
But it won’t slow them down, either! So our suggestion is that when using them would make sense, do so because it can only improve search times.
And finally, Category C (Red) “search filters”
This field doesn’t improve search times. It’s a filter that happens far later in the search, well after most optimizations can be done. It is the ultimate in flexibility, though, and can search fields that are provided in the raw data or fields that were created by our app dynamically.
This doesn’t mean that there aren’t ways to optimize these searches, though!
Let’s suppose you are investigating a claim that calls being placed from your call center are failing. Assuming your call center number is 7118, you may have ended up with a “other search terms”/”search filters” search of ‘callingPartyNumber=7118 NOT call_connected=1‘
This search has completed and has returned 42 results by scanning 44,811 events in 36.645 seconds
Slow slow slow.
But think about this for a second. If the callingPartyNumber is 7118, then we know that at least ONE of the numbers involved was 7118 so we should be able to add that as the number/ext or number to search for too. If we do that, …
This search has completed and has returned 42 results by scanning 84 events in 5.312 seconds
By using the optimization of searching for the number “7118”, we cut our time by 5x. This makes for a much more pleasant experience for only a little extra cognitive load.
Final Words
The key takeaways are summed up thusly:
- Whenever possible, use a number in the Enter Number(s) (formerly the number/ext field). Or several.
- Keep an eye on your timeframe
- Know how the get only … dropdown works and use it wisely.
- Trim results using clusters and other fields if they’re applicable to your search and environment.
Doing those things will make many, if not most, of your searches many times faster and make for a happier you.
Related
Great software ultimately has to empower you to achieve more in less time. This extends to the company behind it -- we have to remember to always use your time as efficiently as we can.
And here I am happy to say that we shortened our Product Overview video dramatically. The new one is only 4 minutes long, vs 11 for the old one. You can see it here:
NOTE: the old one showed more of the product and was definitely more complete. In fact this was deliberate because we used it both for new users and also to be a deeper onboarding video for everyday users. However it was a bit too long for anyone who just wanted the short version and didnt want to spend 11 minutes of their day.
February 1st, 2024